Analysing Candlestick Pattern
Candlestick Patterns Explained: Learn to Analyze with Confidence
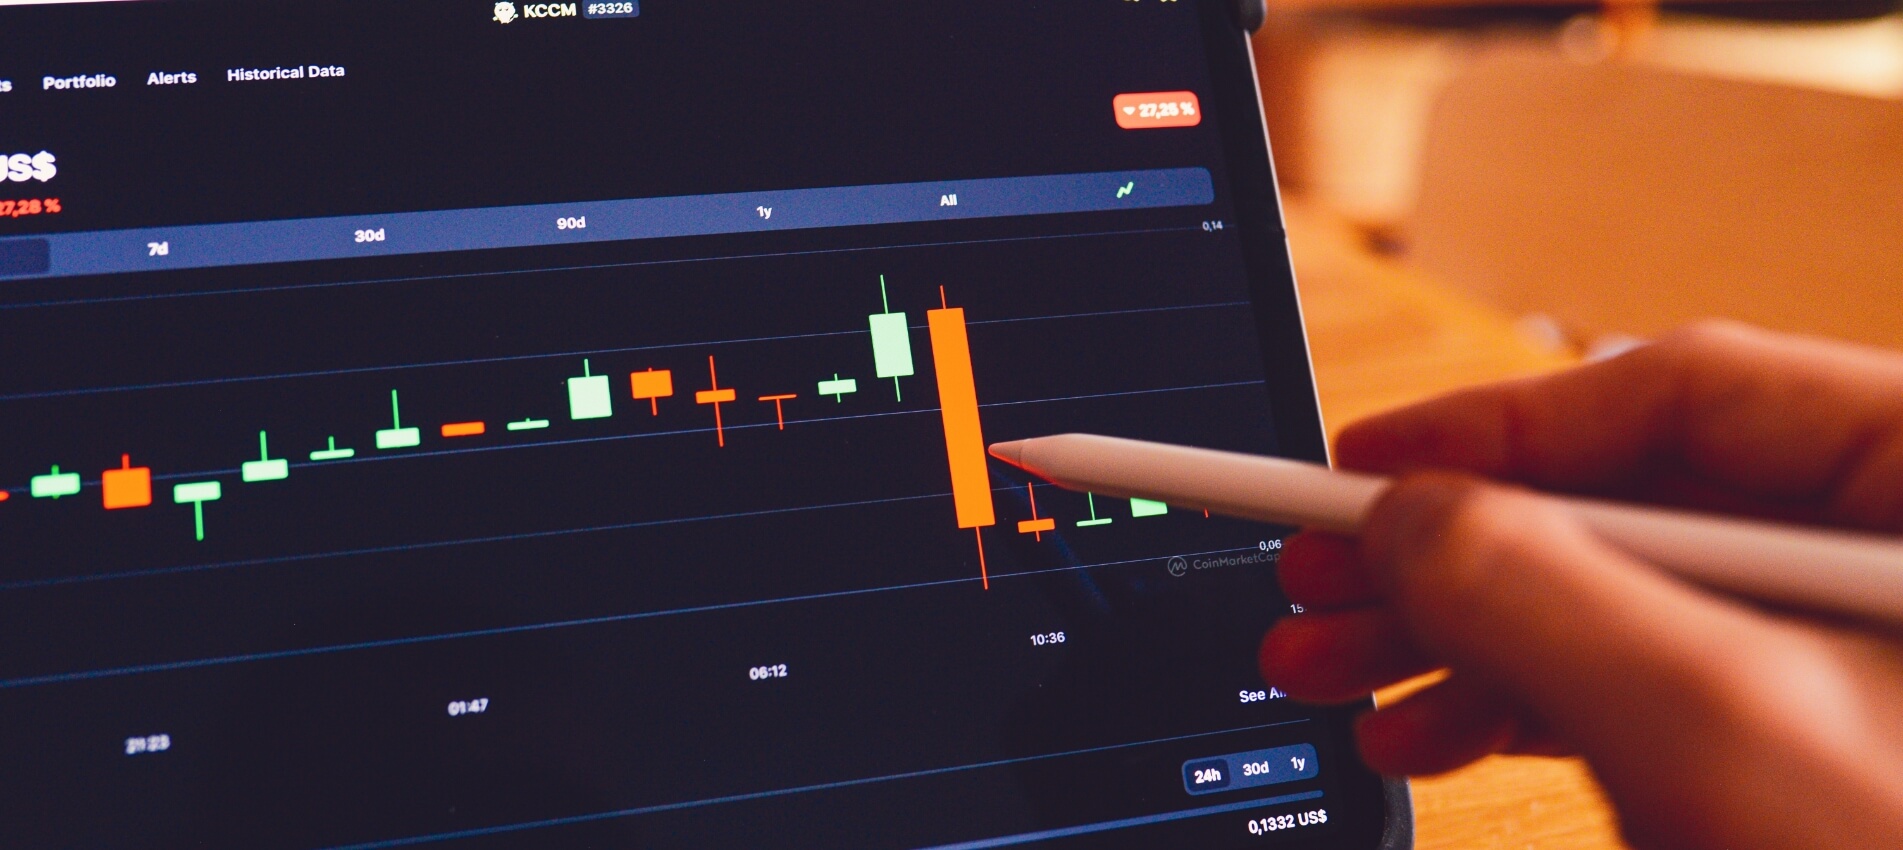
Candlestick patterns are used by price action traders because they transmit a lot of information about each trading session in an easy-to-understand visual style, allowing traders to analyze price behavior over time periods with a single scan of a price action chart. Each candlestick may be "read" as a significant component of the unfolding price story. They convey "market sentiment": whether bears or bulls were in charge (and to what extent), and how far traders were able to drive prices in both directions.
A lengthy candle's body with no shadows or wicks, for example, shows a clear change in the power battle, but a candle with a long top shadowbeyond its body suggests a more contested phase with a bullish attempt to push price higher that was driven back by bearish pressure before the candle closed. Traders have grown to see some recurrent candlestick patterns as accurate indicators of future market activity. The course Technical Analysis: Candlestick Trading for Beginners is designed to provide an overview of some of these patterns, which may assist traders in making sense of market circumstances and identifying the best moments to join trades.
The ability to interpret candlesticks helps a price action trader to become a meta-strategist by considering the actions of other traders and large-scale market movers. Candlestick patterns, in other words, assist traders.

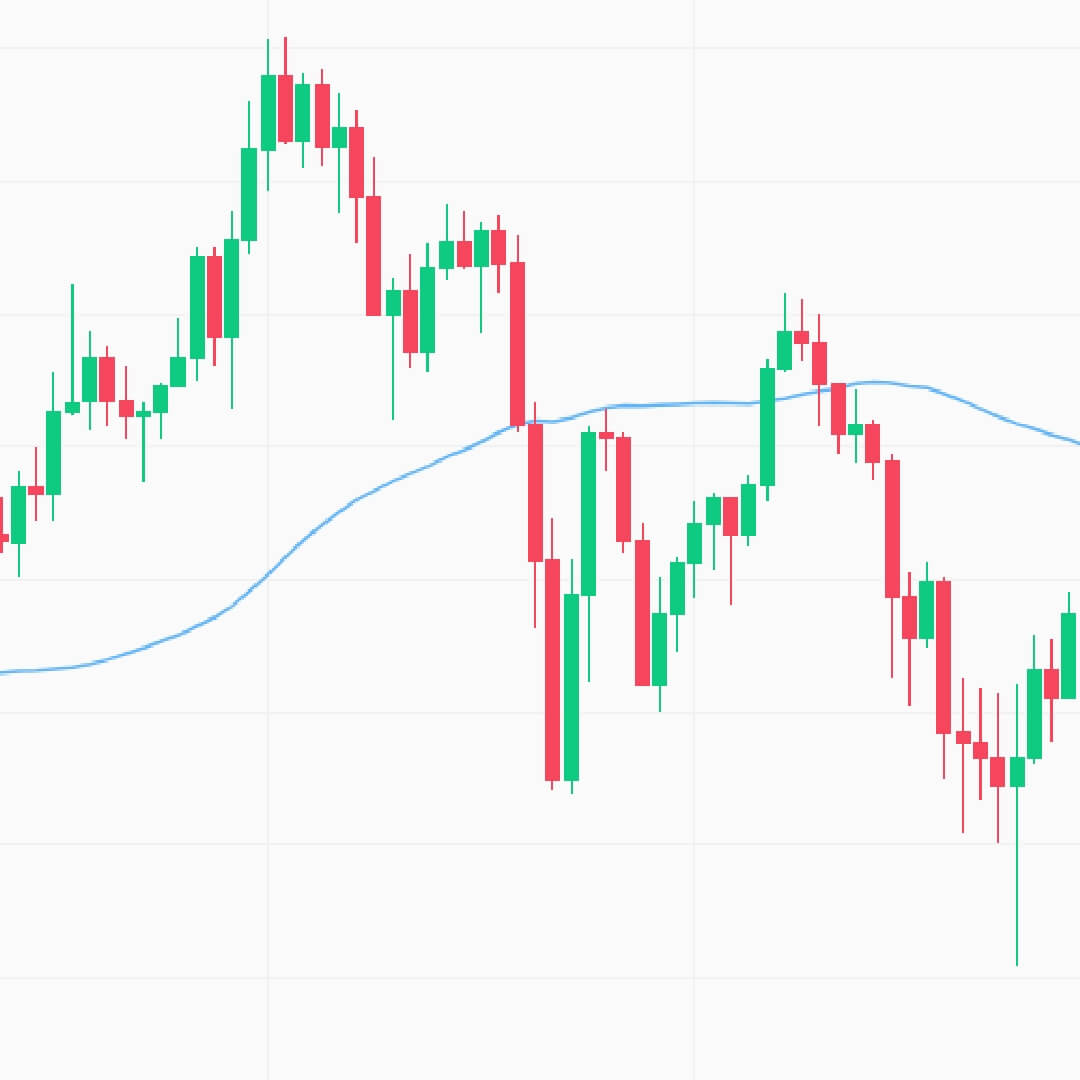
Long bodies imply significant buying or selling pressure. For example, if the close is above the open on a candlestick with a long body, this suggests that buyers are stronger and are gaining control of the market at this moment.
In contrast, if there is a bearish candlestick with a lengthy body and the open is above the close, it indicates that selling pressure is considerable and that sellers are in charge of the market during this time period.

The majority of the trading activity was concentrated at the open and close, as shown by candlesticks with short shadows. If a candlestick's top shadow is longer than its lower shadow, it implies that buyers exercised their muscles and raised the price. But, for whatever reason, sellers entered the market and pushed the price back down, bringing the session to a close around the open price, demonstrating the strong rejection of higher prices.
If a candlestick has a lengthy lower shadow and a short upper shadow, sellers revealed their washboard abs and pressured the price down. However, for whatever reason, buyers entered the market and pushed prices back up, bringing the session to a close around its open price. It also demonstrates a significant opposition to lower pricing.

The above image shows that buyers are in charge, as indicated by a strong, lengthy body of candlestick. And the selling pressure is light, as shown by the candlestick's tiny upper shadow.

The extended upper shadow in the above graphic indicates that the sellers are in charge, since they have reversed much of the previous gains. The body is small, indicating that the buyers are losing power and that the sellers are triumphant. Despite the fact that it is a bullish candle since the price is close to the open price and the candlestick is green, the entire picture is bearish at the time. Because the lengthy upper shadow indicates that the bulls have lost control and the bears are in command.