Computer
Learn the most important computer tips and tricks that everyone should be aware of.
Smartphones
Discover the finest smartphone tips and techniques that everyone should be aware of.
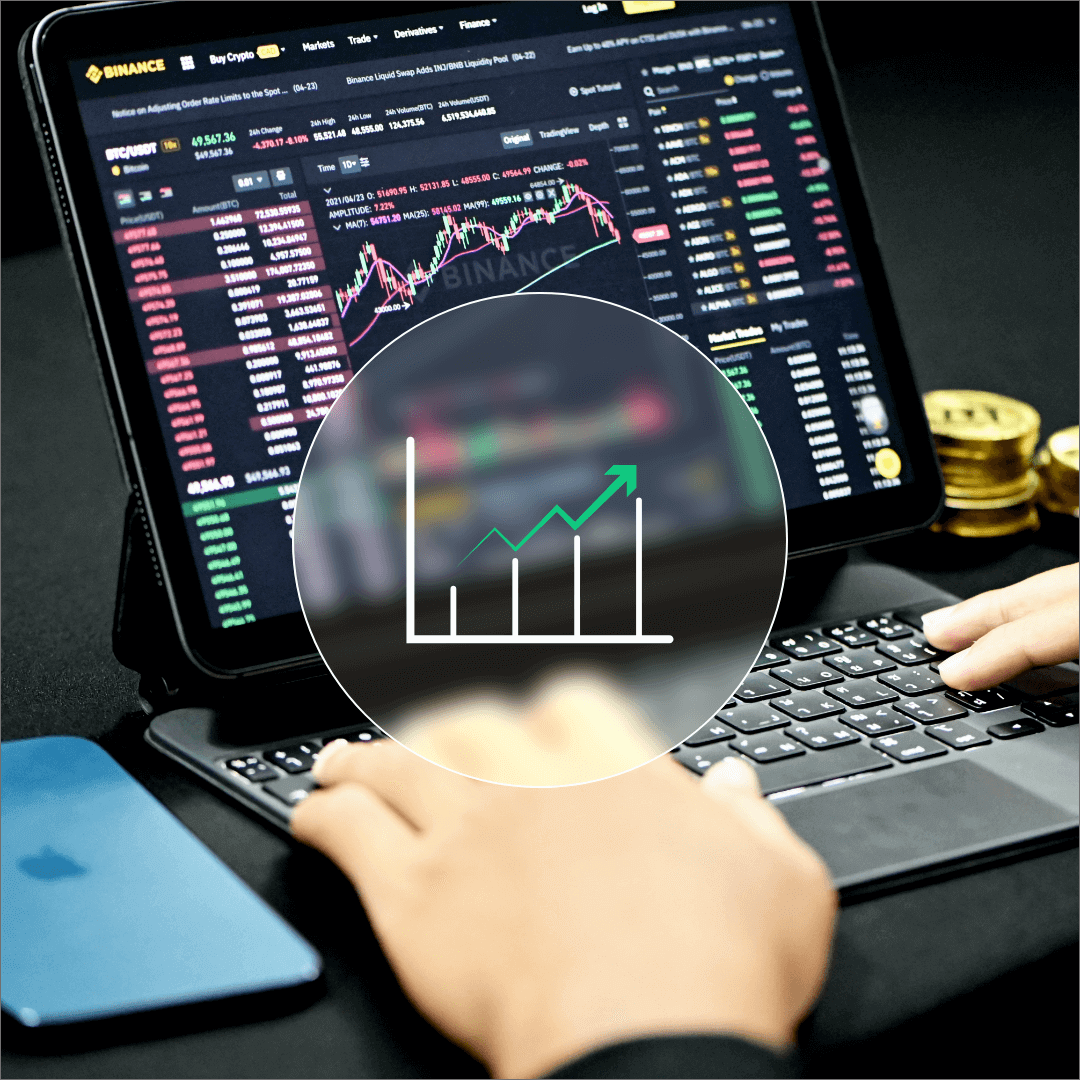
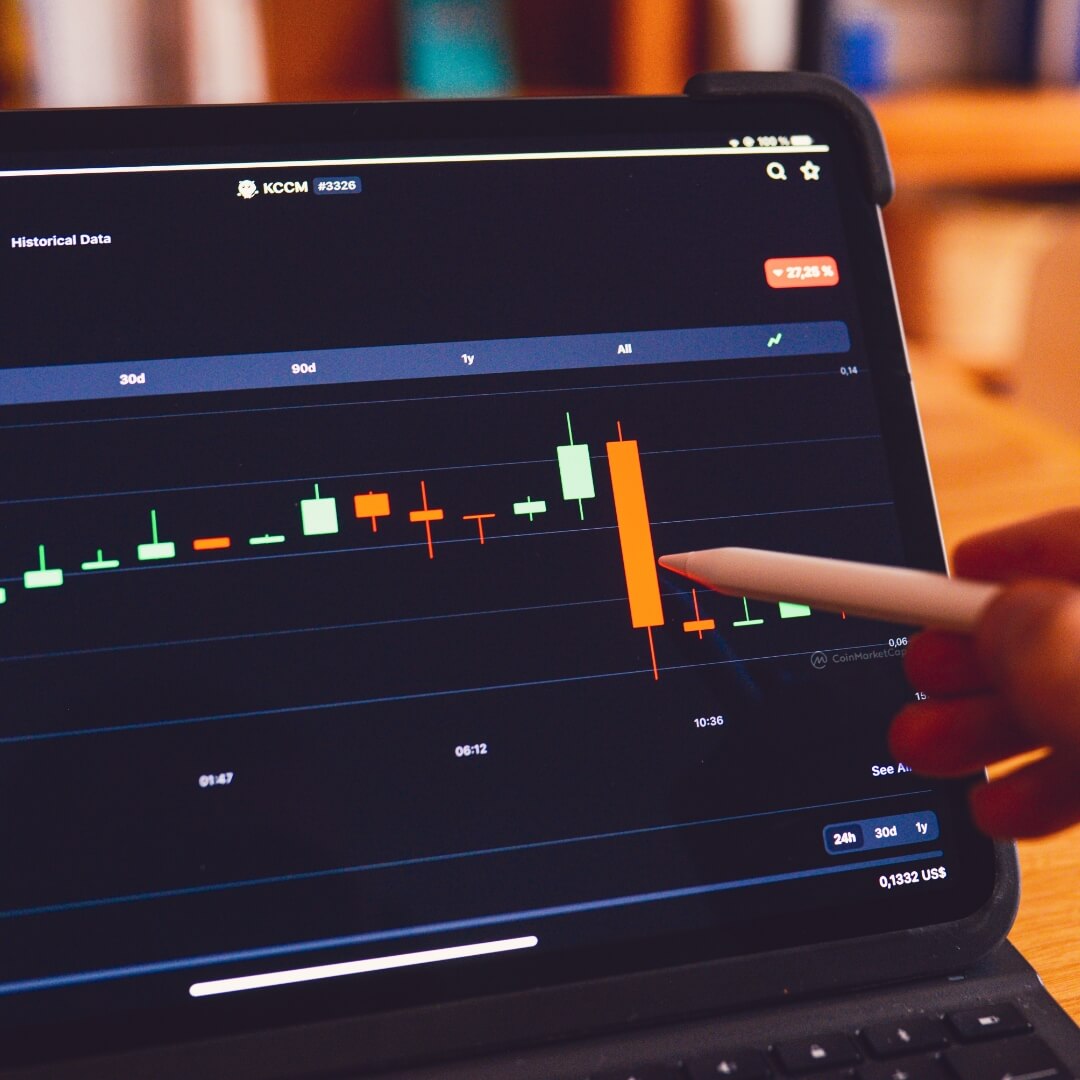
Crypto Trading
Our articles will teach you all you need to know about Cryptocurrency trading
Security
Learn more about computer security and how to protect yourself from cybercriminals.
Featured Content

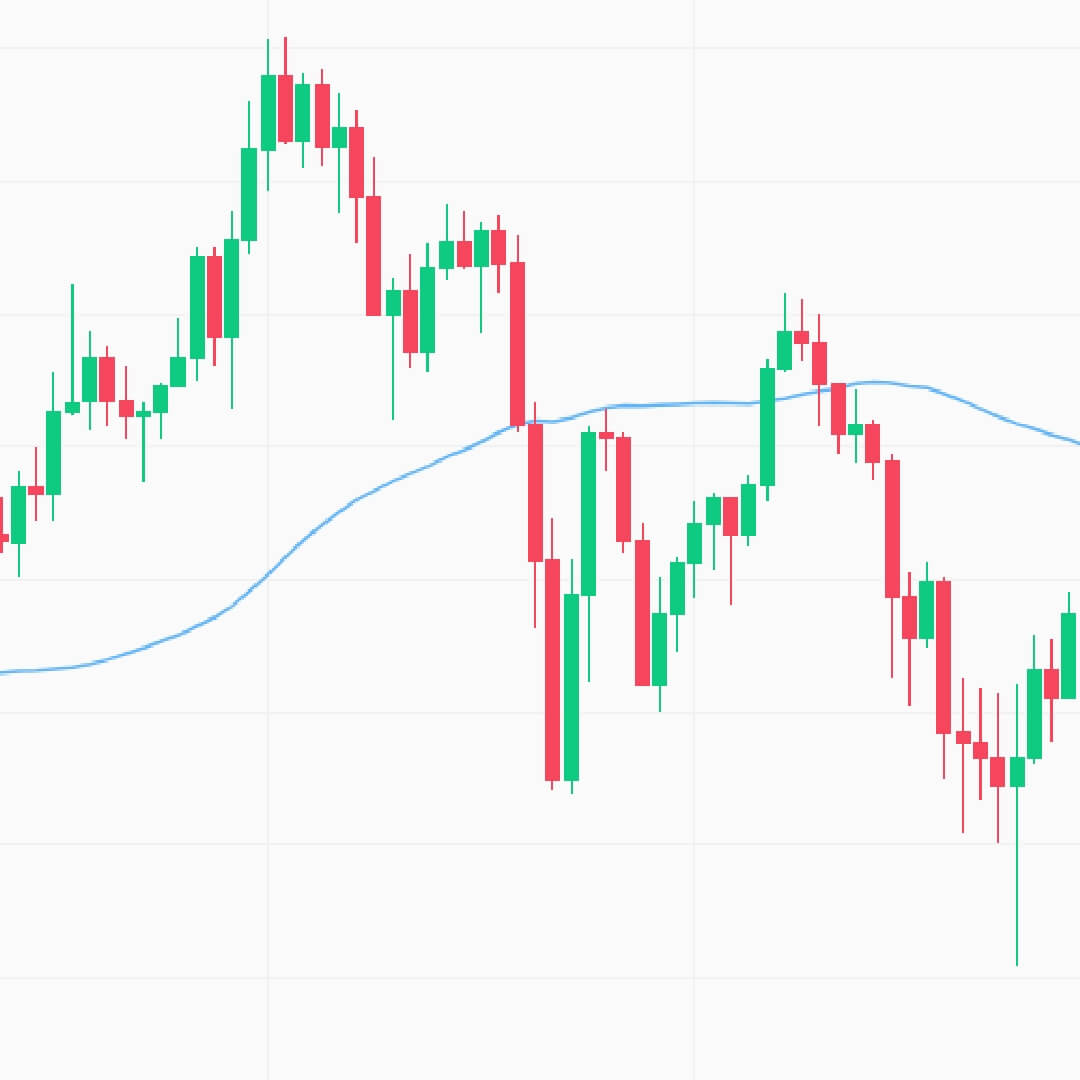
Bearish Candlestick Patterns.
A bearish candle, sometimes known as a bear, is one that predicts lower prices...
Explore Patterns

Bullish Candlestick Patterns.
A bullish candle, commonly known as a bull, indicates that the holder anticipates that pric...
Explore Patterns

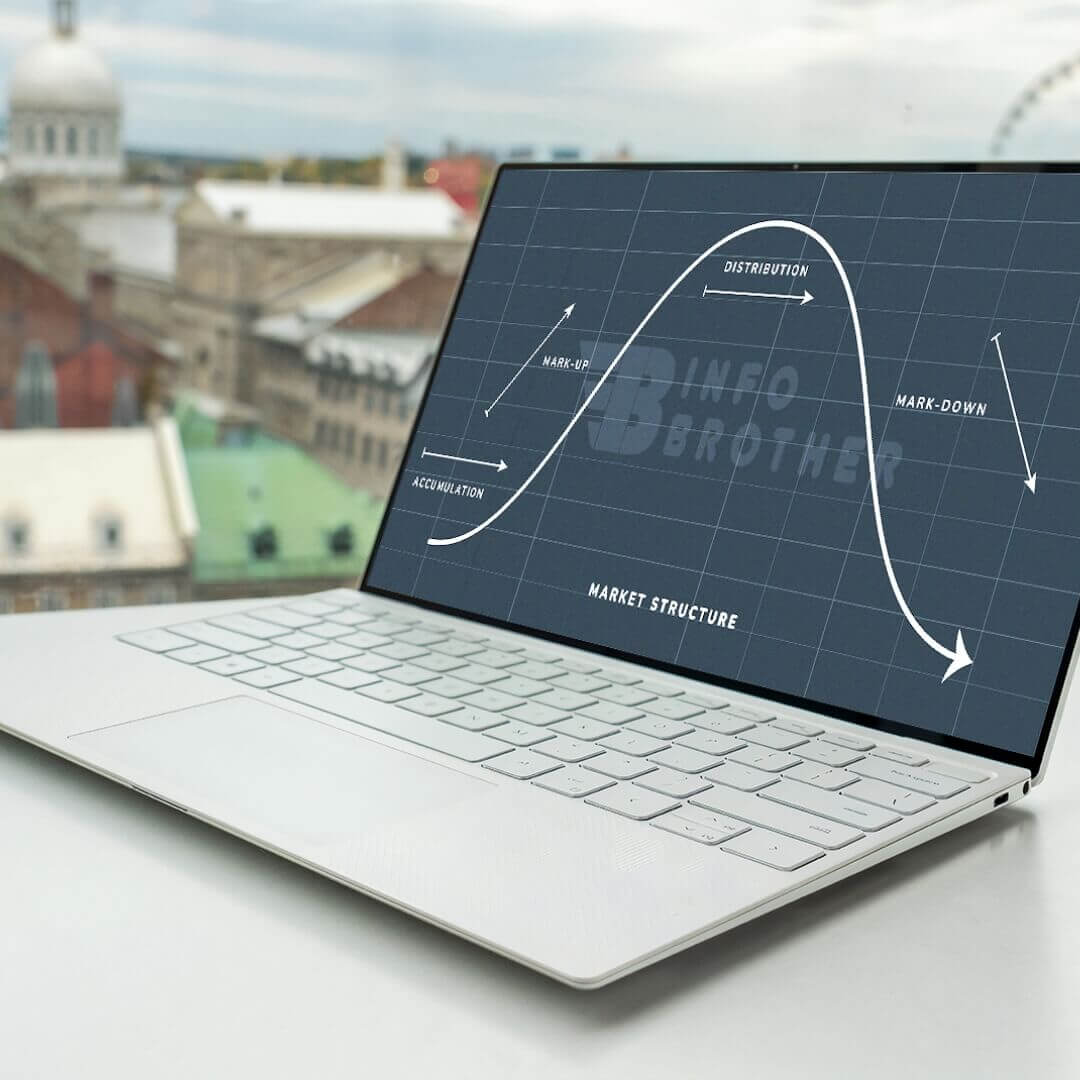
Neutral Candlestick Patterns.
A continuation pattern is a pause in a dominant trend. Nobody can predict whether...
Explore Patterns
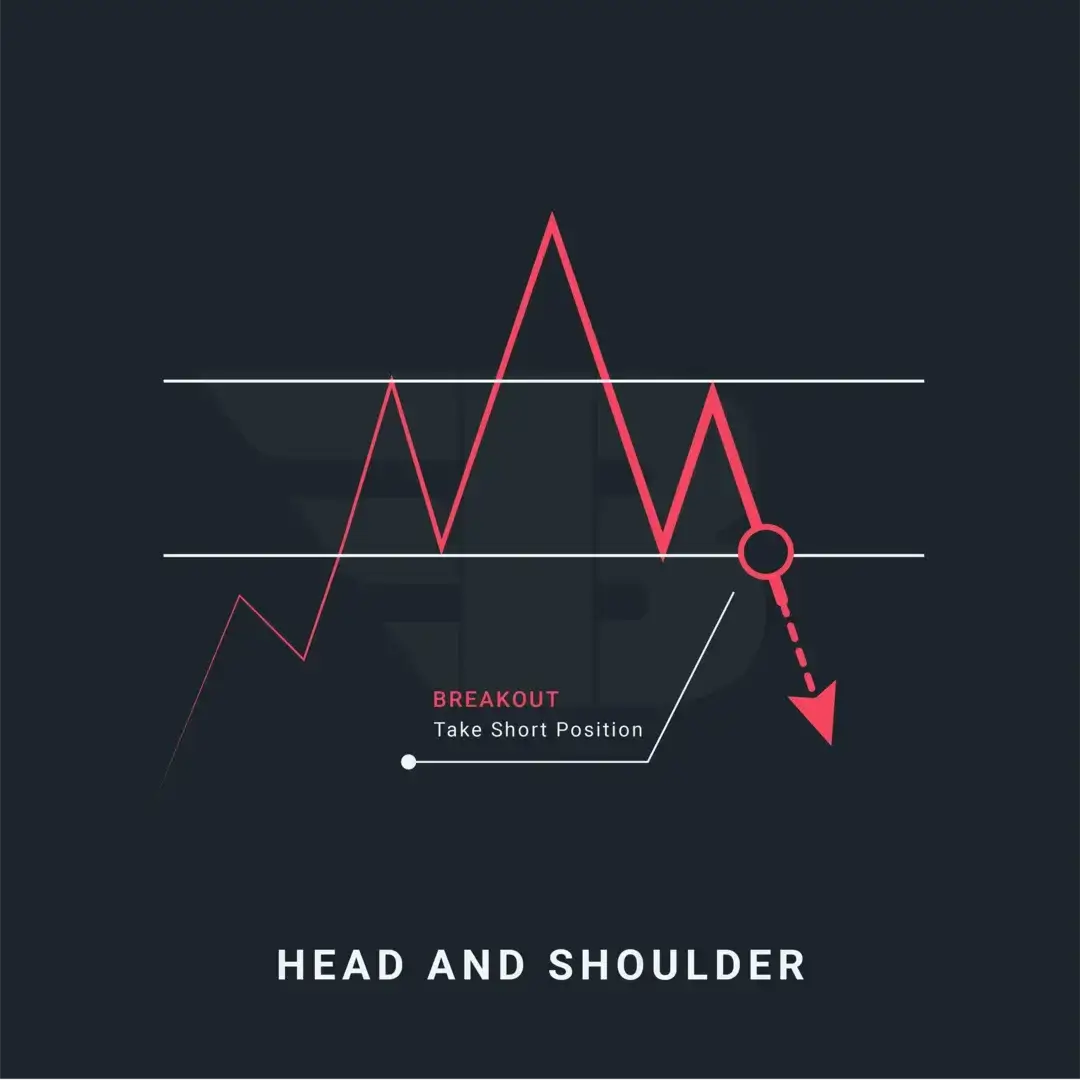
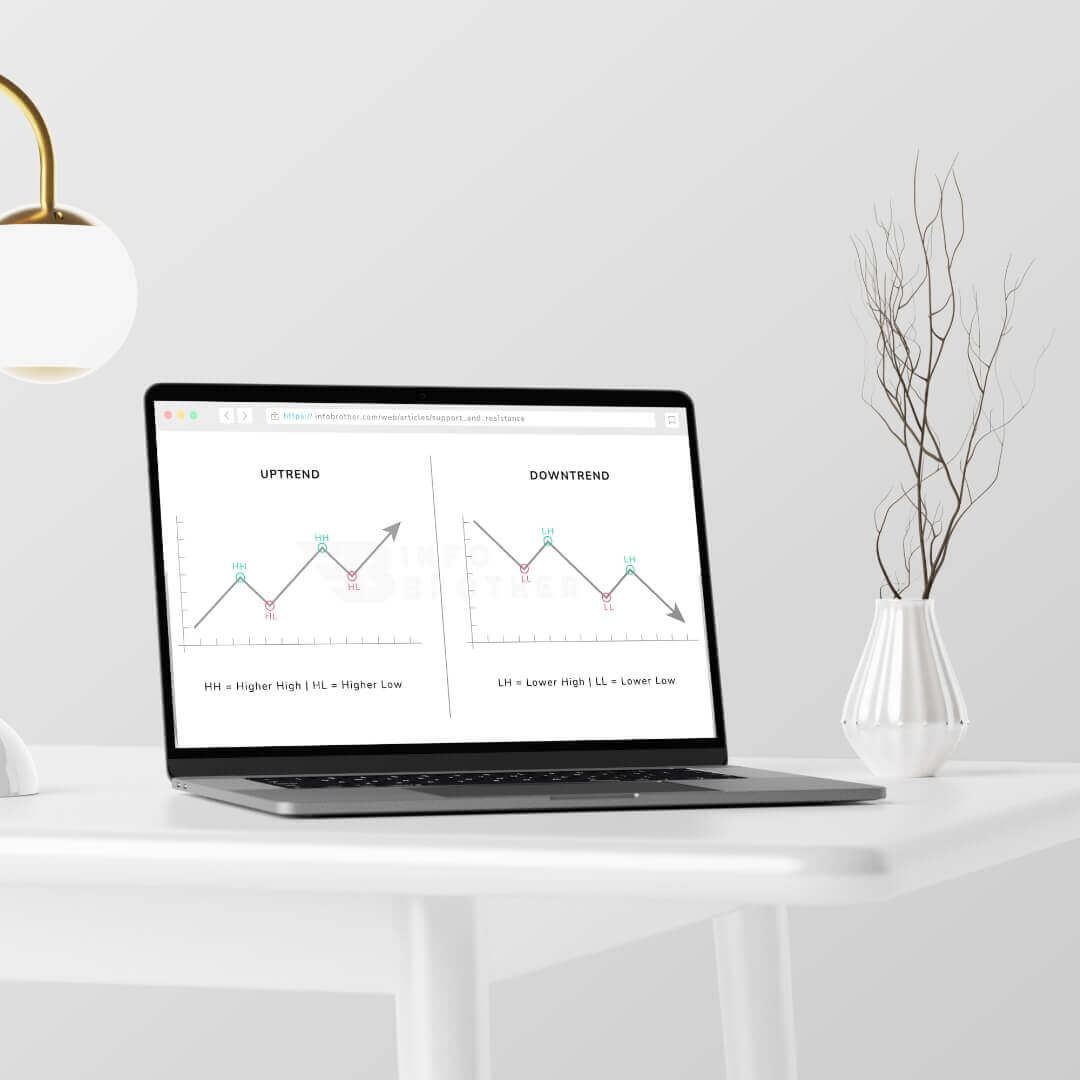
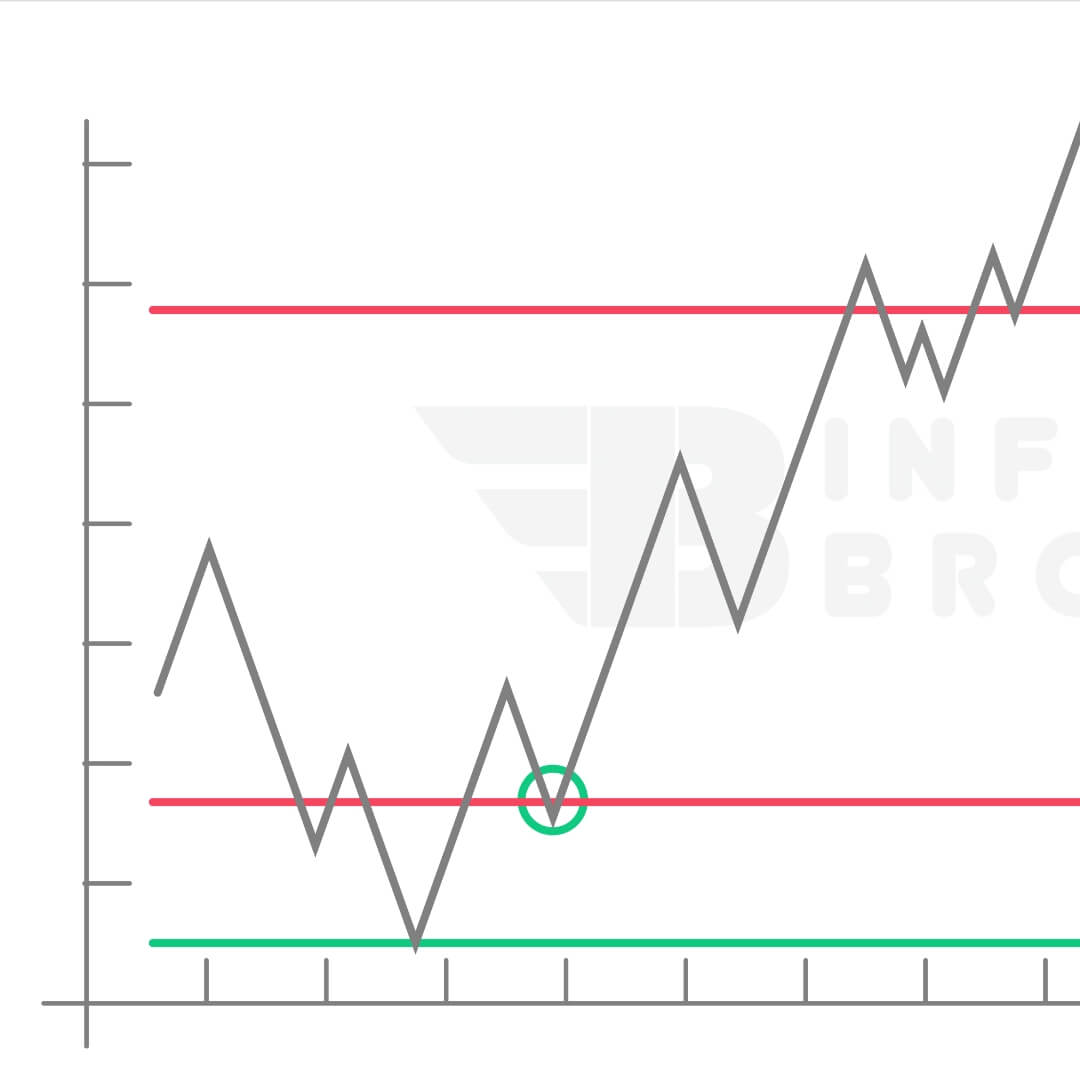
Chart Patterns - Technical Analysis
A chart pattern is a shape within a price chart that helps to suggest what prices might do next, based on what they have done in the past.
Explore Patterns