Price Action Trading - 04 Things to Consider Before Making a Trade:

Price Action Trading

04 Things to Consider Before Making a Trade


infobrother.com

SARDAR OMAR


Without depending on indicators, news, or views, price action trading allows us to better comprehend the timing of our market entrance and exits. However, fitting the piece together may be challenging due to the abundance of information accessible, such as candlestick patterns, chart patterns, trendlines, support and resistance, and so on. And we're left with a slew of questions, such as where to begin, what to search for, and how to make sense of it all. However, after years of trading and experimentation, it has been determined that in price action trading, only four factors matter—the rest may be ignored.

We'll go over each of these factors in more depth later, but first, let's define price action trading.

Candlestick Technical Analysis

Technical Analysis: Candlestick Trading For Beginners

This course will teach you how to utilize Japanese candlestick patterns to predict market turns.


Price action describes the characteristics of a security's price swings. This movement is often analyzed in light of recent price swings. To put it another way, price action is a trading method that allows a trader to read the market and make subjective trading decisions based on current and actual price movements rather than only on technical indicators.

To assist us in making better trading selections, price action trading uses previous prices (open, high, low, and close). Unlike indicators, fundamentals, or algorithms, price action tells us what the market is doing rather than what you think it should do.

Price action trading assists us in better understanding the market and making lucrative trading decisions. Using the price action trading strategy may allow us to pinpoint our inputs and exits with more accuracy. When it comes to price action trading, there are Four things to consider.

Market structure is an old notion that has existed for as long as financial markets have been. The fundamental concepts, on the other hand, remain crucial. Especially when it comes to price movement analysis and recognizing trading opportunities. Knowing upward, downward, and sideways trends are aided by understanding market structure. The same ideas apply to all markets, including stocks, futures, FX, commodities, digital assets such as cryptocurrency, and physical assets such as real estate.

A price action trader must first comprehend market structure. We won't be able to buy, sell, or stay out of the market if we don't understand it. However, If we understand market structure, a world of possibilities opens up before us.


So, what is the structure of the market?

It's a technique for classifying market stages so we can figure out what to do in different market conditions. In other words, market structure tells us whether to purchase, sell, or stay out of the market.

Market cycles occur in all financial markets. It's a natural cycle that will undoubtedly build and dissipate over time. There are four stages to every market cycle. Let's take a look at each one separately.

Market Structure in trading - cycle of market in trading

The interval between a market's high and trough and its phases is referred to as a "crypto market cycle." All financial markets experience market cycles. It's a natural sequence of cycles that will inevitably develop and go as time passes. Every market has cycles, which are divided into stages. Prices increase, peak, decline, and finally bottom out, signaling the start of a new cycle.

Novice traders may not realize that markets are cyclical, and as a result, they frequently fail to plan for the conclusion of the present market cycle. Furthermore, even if we understand market cycles, predicting the peak or bottom of a specific cycle can be difficult. To optimize our trading profits, however, we must comprehend the cycle. Let's have a look at the four major stages of a normal market cycle and how to spot them.

Accumulation Phase (Range market in a downturn) - cryptocurrency trading

Accumulation Phase (Range market in a downturn)


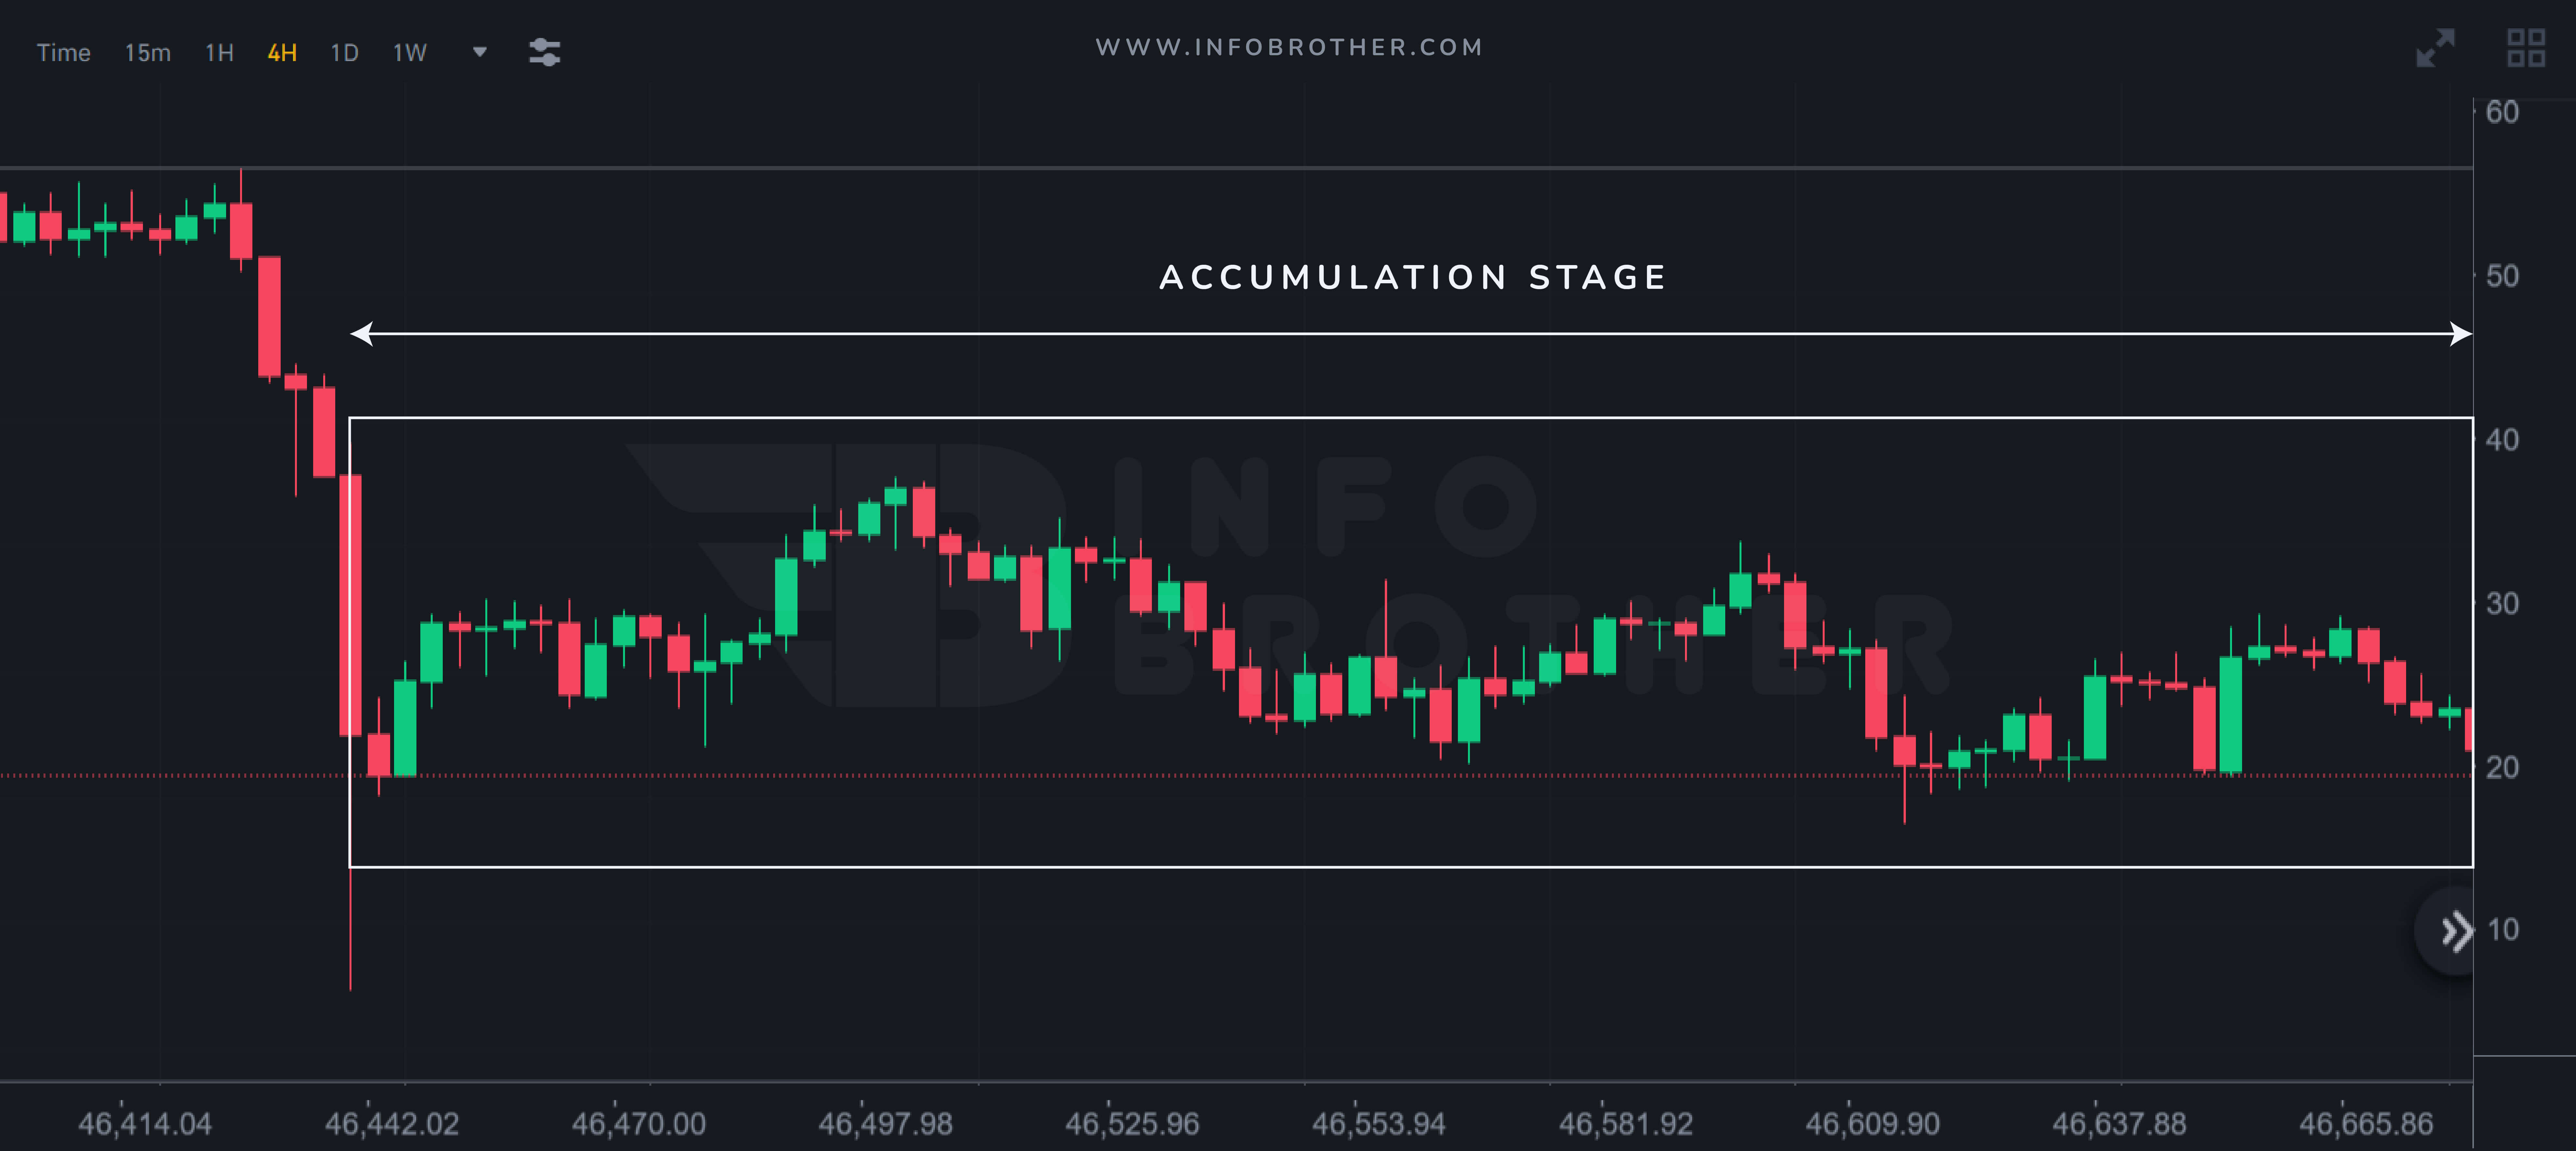
After the market has fallen from its prior high, it enters this phase. As the price falls, bullish traders begin to purchase, creating a purchasing push in the market. The bears, on the other hand, continued to sell in the hopes that the decline would continue. This battle between bulls and bears has brought the market to a state of equilibrium, giving it the appearance of a "range market" in a downturn.

Although the market is now in an accumulation period, this does not always imply that it will break out higher. It might break down at a lower level. So, at this phase, we have two options:

  • We may look for buying opportunities when the market is at a support level or when the price breaks through resistance.
  • We might look for selling opportunities when the market reaches resistance.
Mark-Up Phase (Bullish Market) - cryptocurrency trading

Mark-Up Phase (Bullish Market)


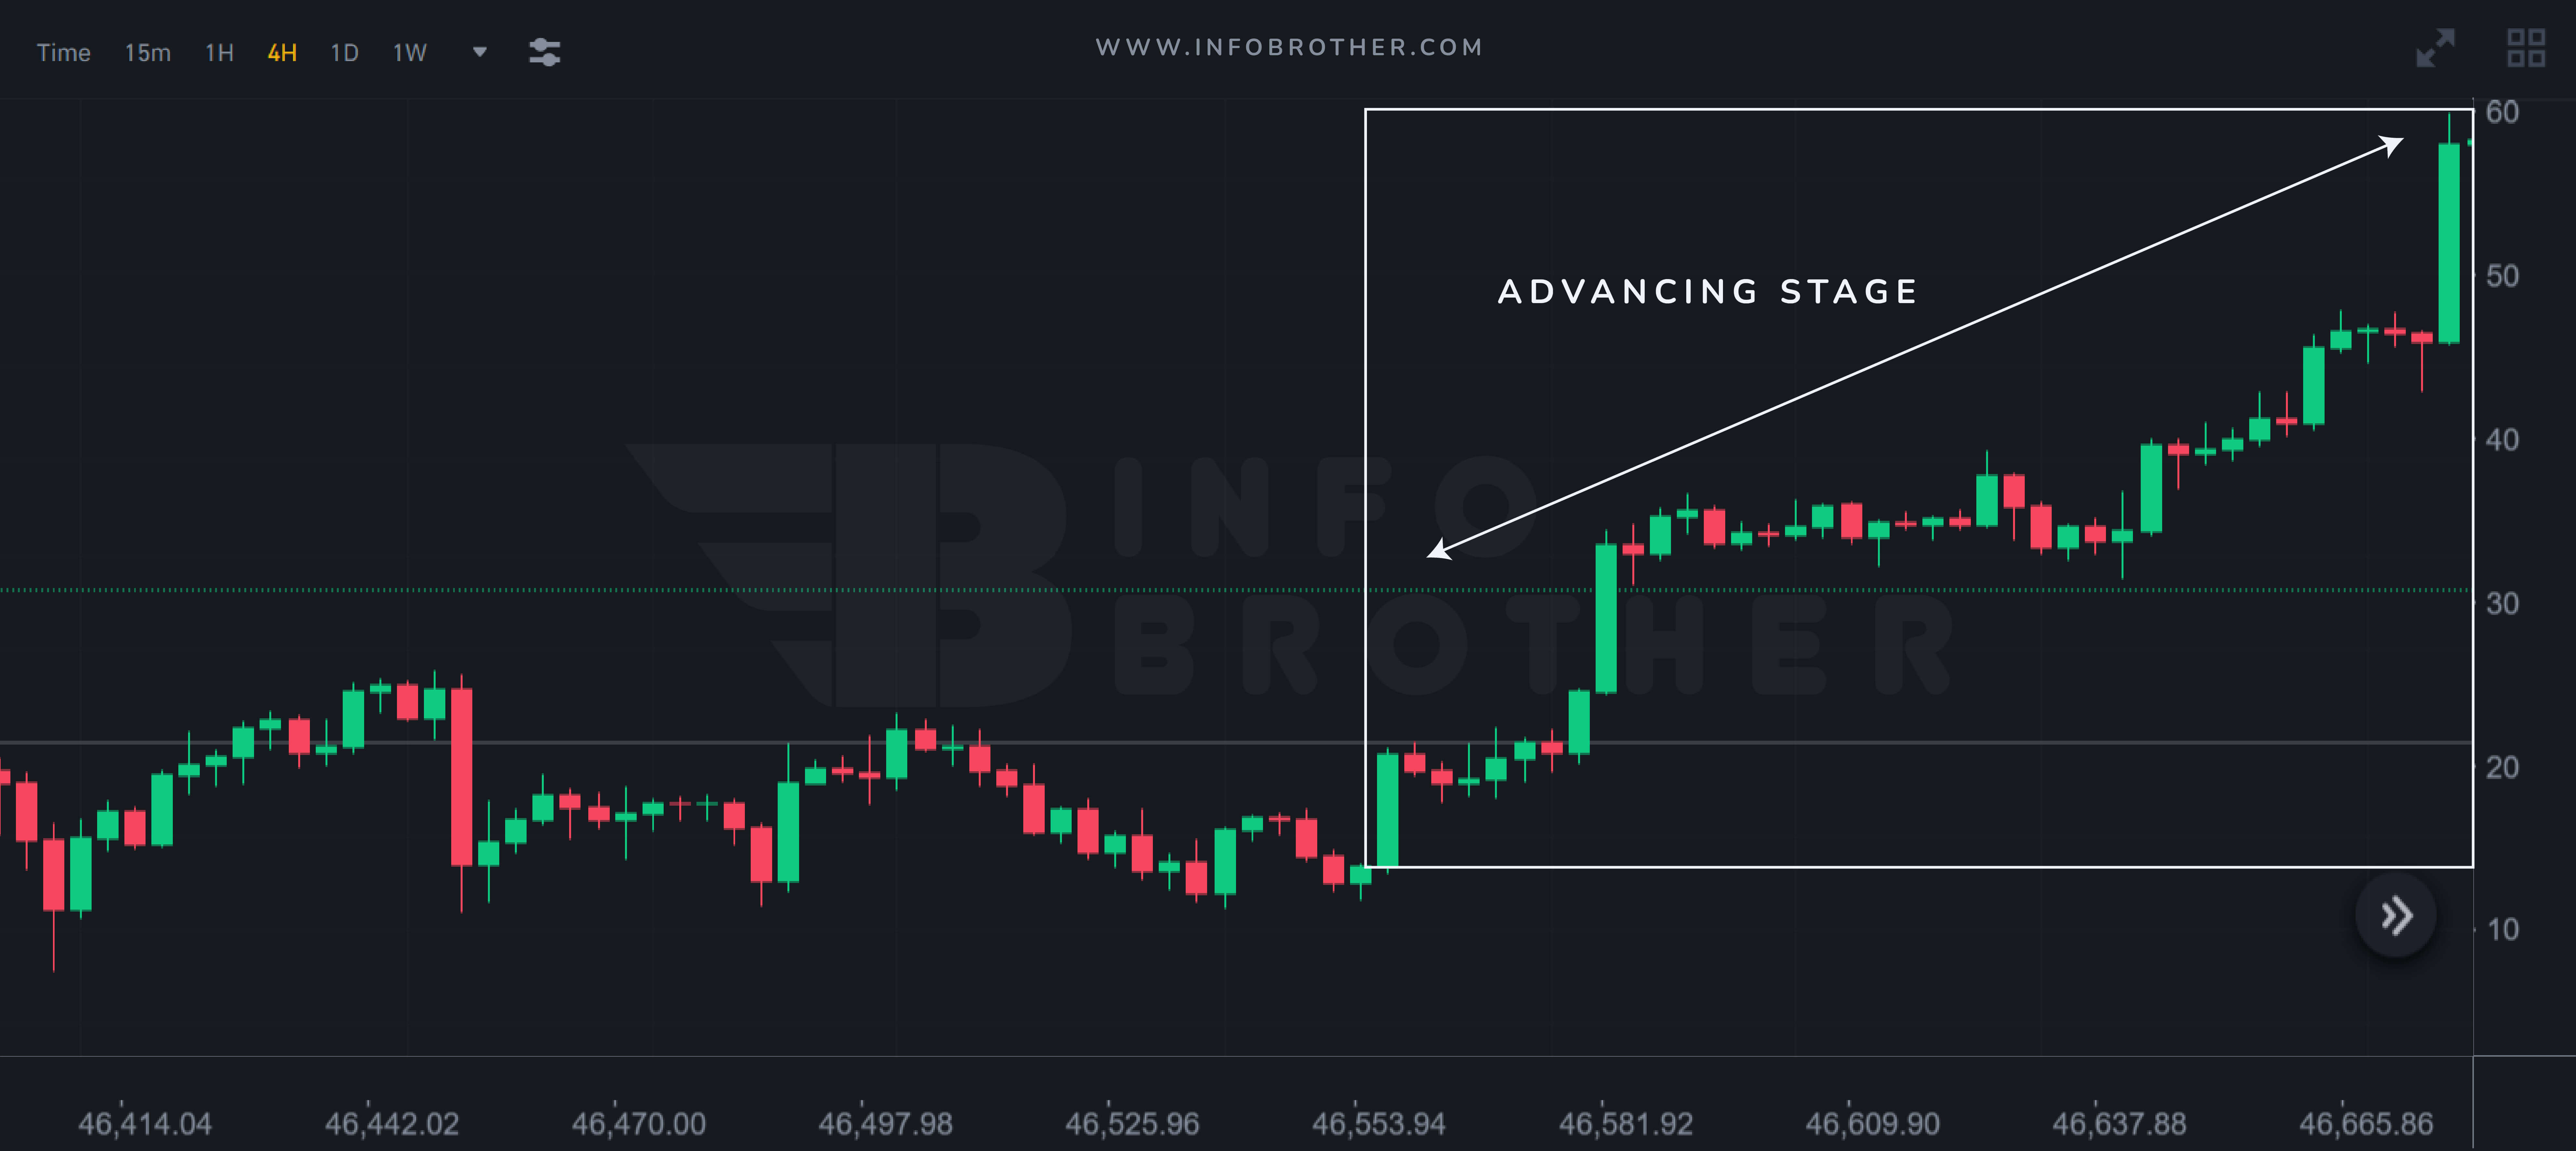
The accumulation period is over, the market has been steady for some time, and prices are beginning to rise. This phase is also known as an uptrend in market structure since it has a succession of rising highs and lows. However, the market is still struggling to achieve any significant price gains since every time the price rises, there are still sellers waiting to prevent the advance. At this stage, most traders are aware of the trend and are looking for chances to purchase. However, no market continues to rise indefinitely; it will ultimately exhibit symptoms of weakness, and the trend will shift to the next stage.

Distribution Phase (Range market in an upswing) - cryptocurrency trading

Distribution Phase (Range market in an upswing)


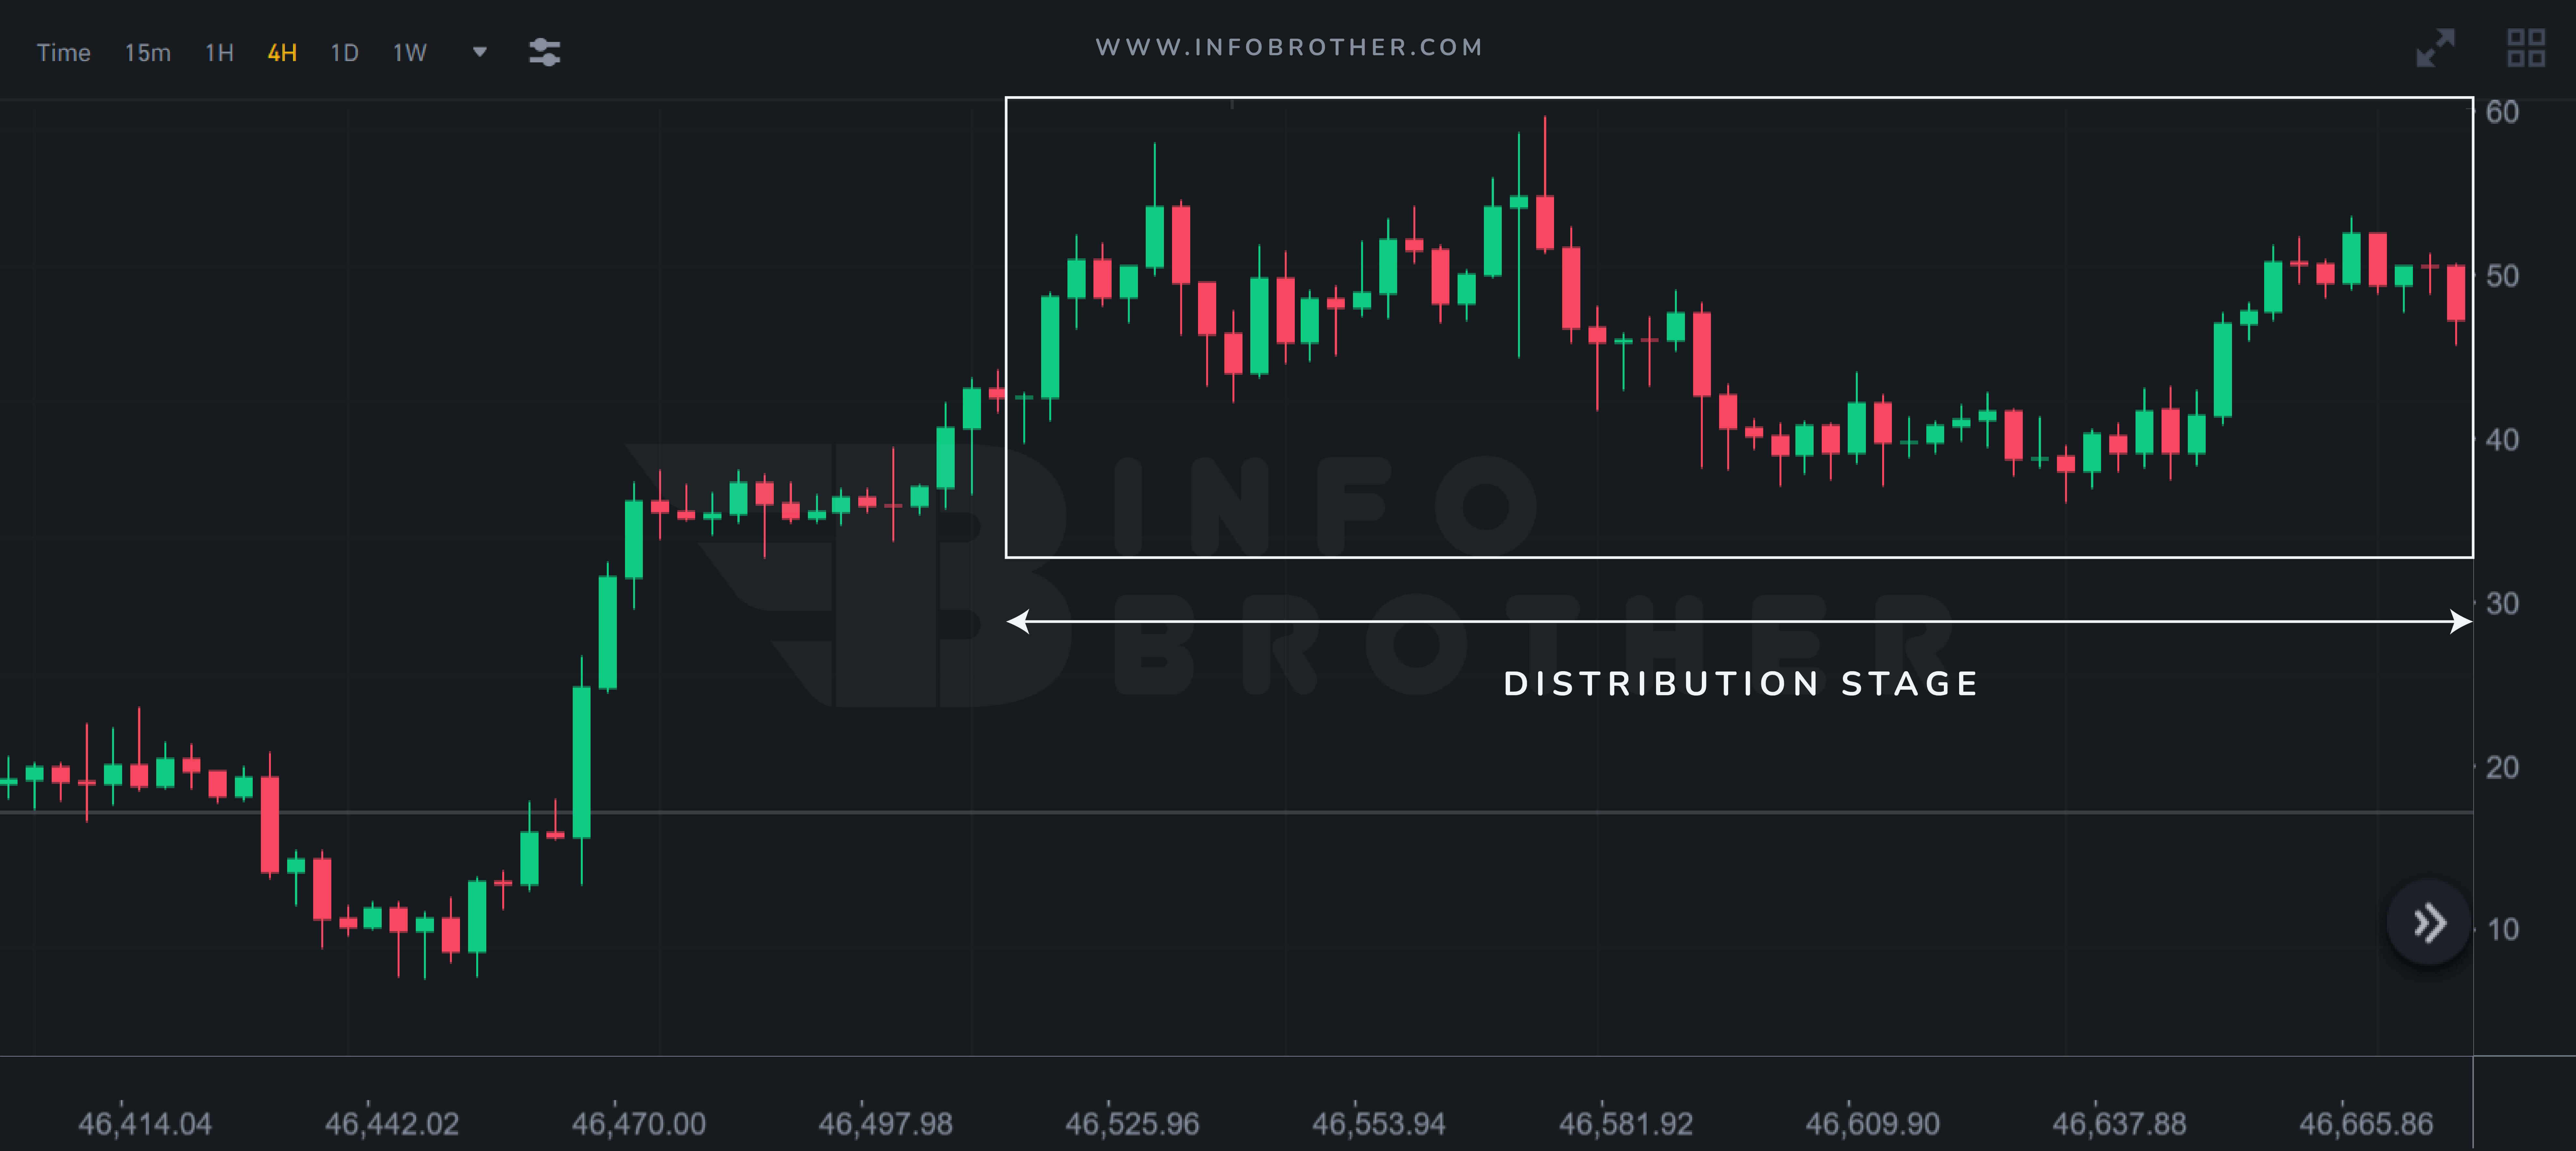
Sellers take control in the third phase of the market cycle. The positive feelings of the previous phase give way to a mixed sentiment during this phase of the cycle. Prices may sometimes be trapped in a trading range for weeks or months at a time. The bears will search for a selling opportunity as the price rises, while the bulls will continue to purchase in the hopes of the trend continuing. The market is at an equilibrium stage as a result of the bull-bear battle, and it seems to be a "range market" in an upswing.

The trend may continue and the price breakout higher after this phase, but it also has the potential to break down lower. So, in this phase, we have two options:

  • If the market price breaks above resistance, we will assume the trend will continue and look for a buying opportunity.
  • We will presume the range market will continue and hunt for a selling opportunity if the market price breaks below support.

If the price falls below the range's lows, we'll reach the last phase.

Market Cycle in trading marekt

Mark-Down Phase (Bearish Market)


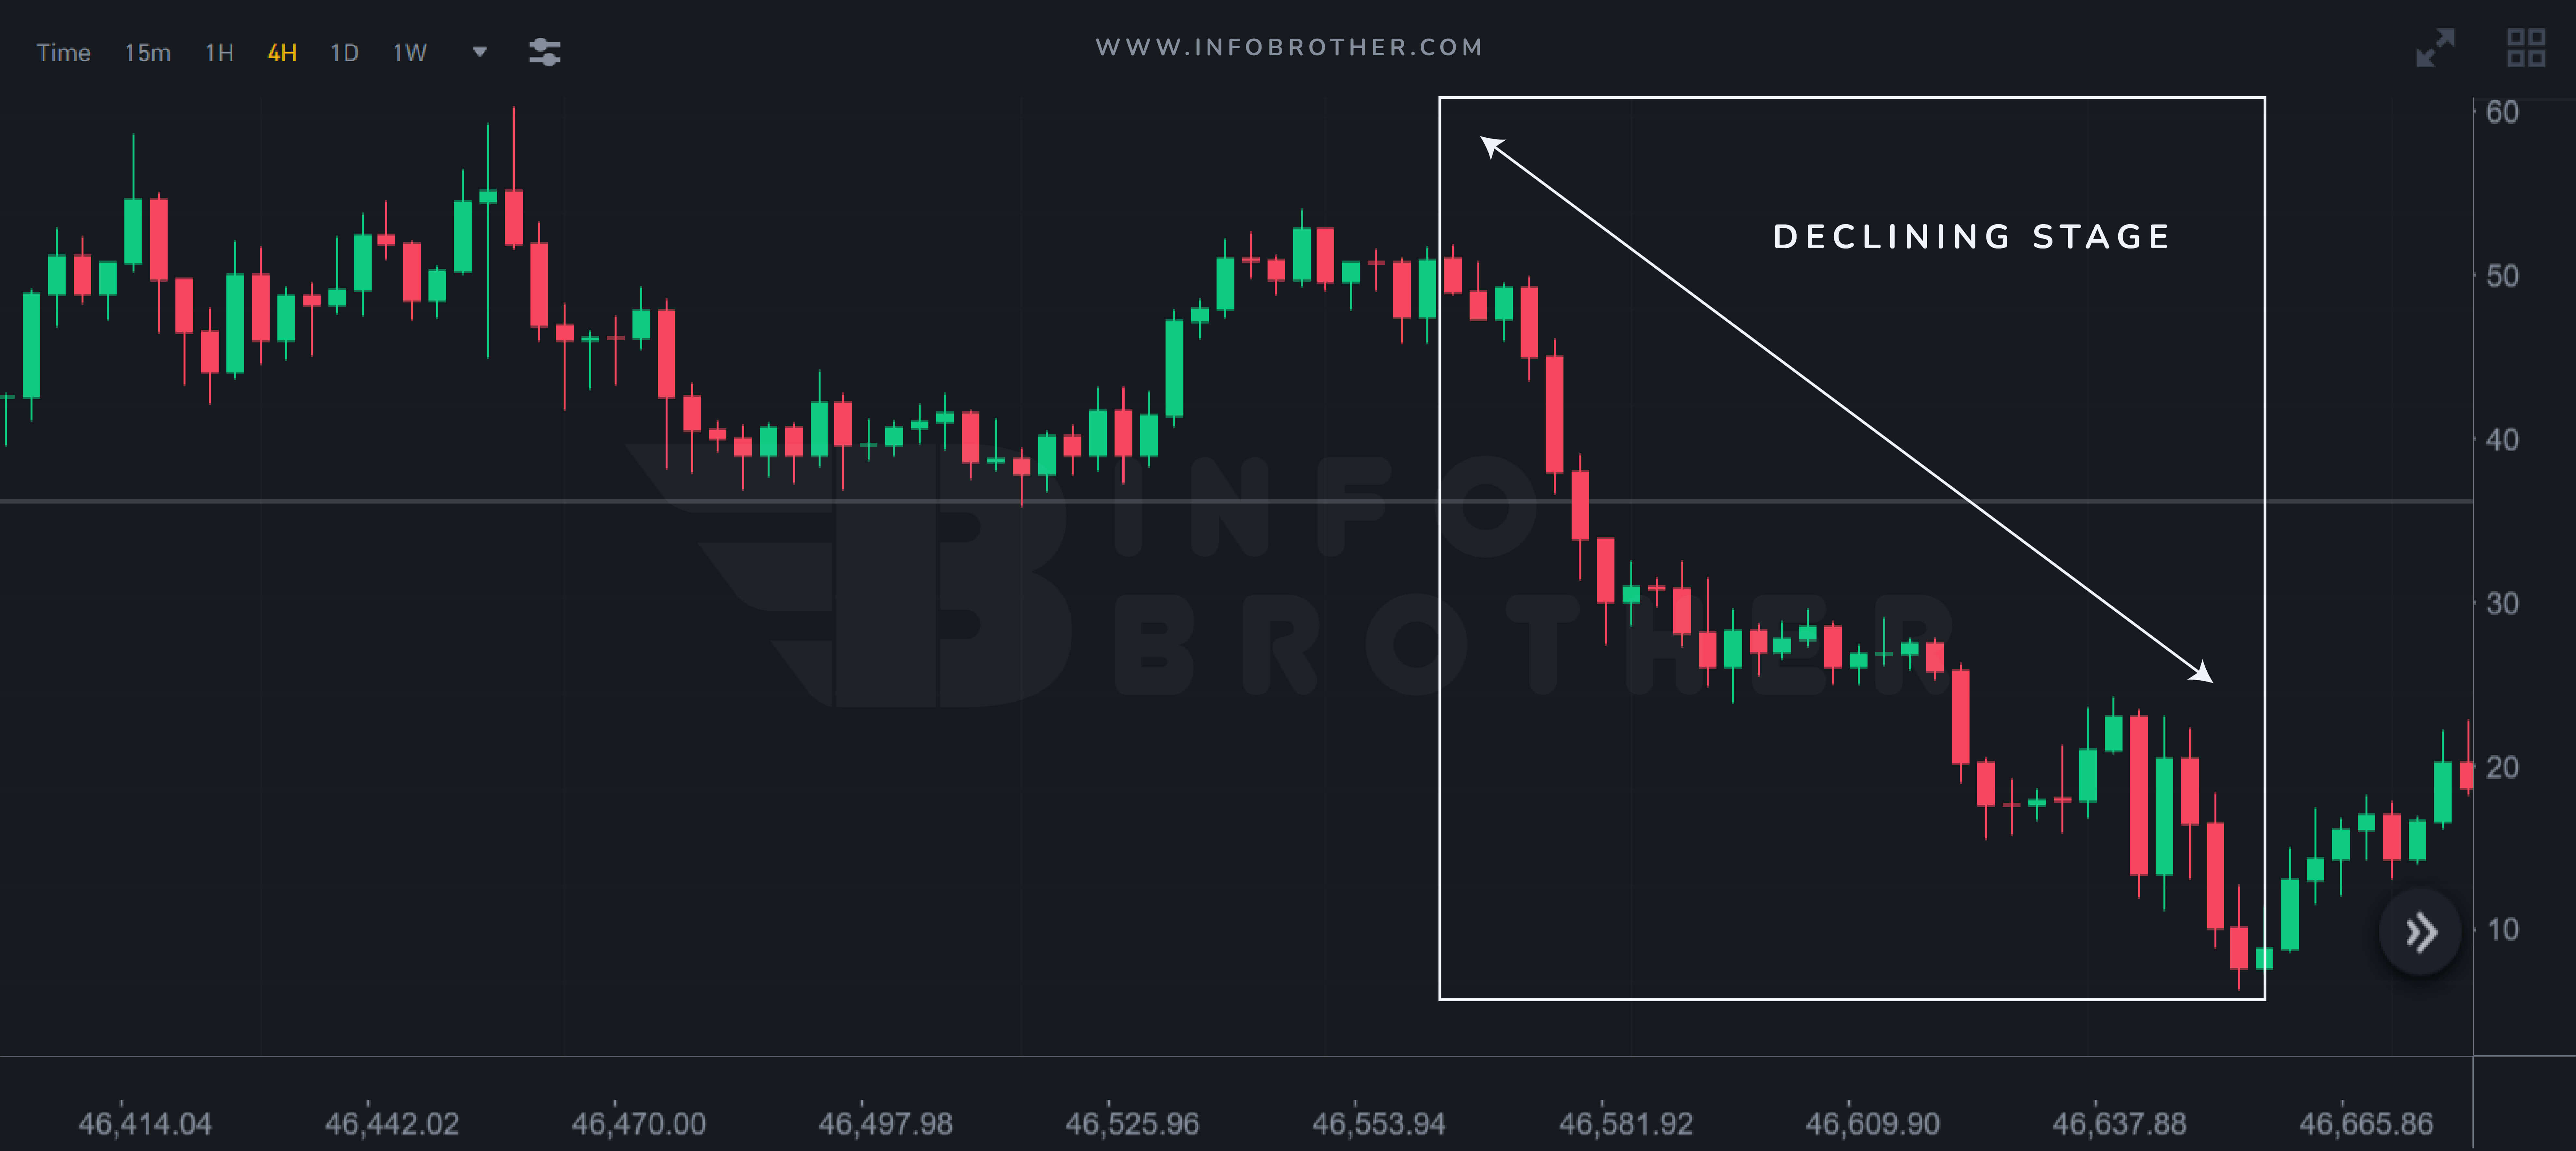
For those who still maintain employment, the fourth and final phase of the cycle is the most agonizing. The investors that are caught up in this stage are typically novice and fresh. They stick to their investment since it has lost a lot of value since they bought it. This group of investors, who often purchase during the distribution phase or the beginning of the markdown phase, may only abandon their positions if the market falls by 50% or more. Late-cycle traders lose hope and eventually reduce their losses when this occurs.

This phase is also characterized as a decline with a sequence of lower highs and lows in the market structure. Most traders recognize the trend at this point and begin looking for selling opportunities. However, no market is always down; at times, it will begin to show indications of strength, and we will return to the first phase

We've studied how the market works and how the market structure signals when it's time to buy, sell or stay out. The next step is to choose where we will purchase or sell. 'Area of value' is used to obscure this question.

So, what exactly is the area of value?

The 'area of value' is a price range where the bulk of trade activity occurred the day before. This is the range in which 70 percent of the previous day's volume occurred. The value area is around one standard deviation above and below the greatest volume pricing average.

An area of value on our chart is a location where prospective buying or selling pressure might emerge. We need to talk about two things to figure out what the 'area of value' is.

Support and Resistance

Support and Resistance


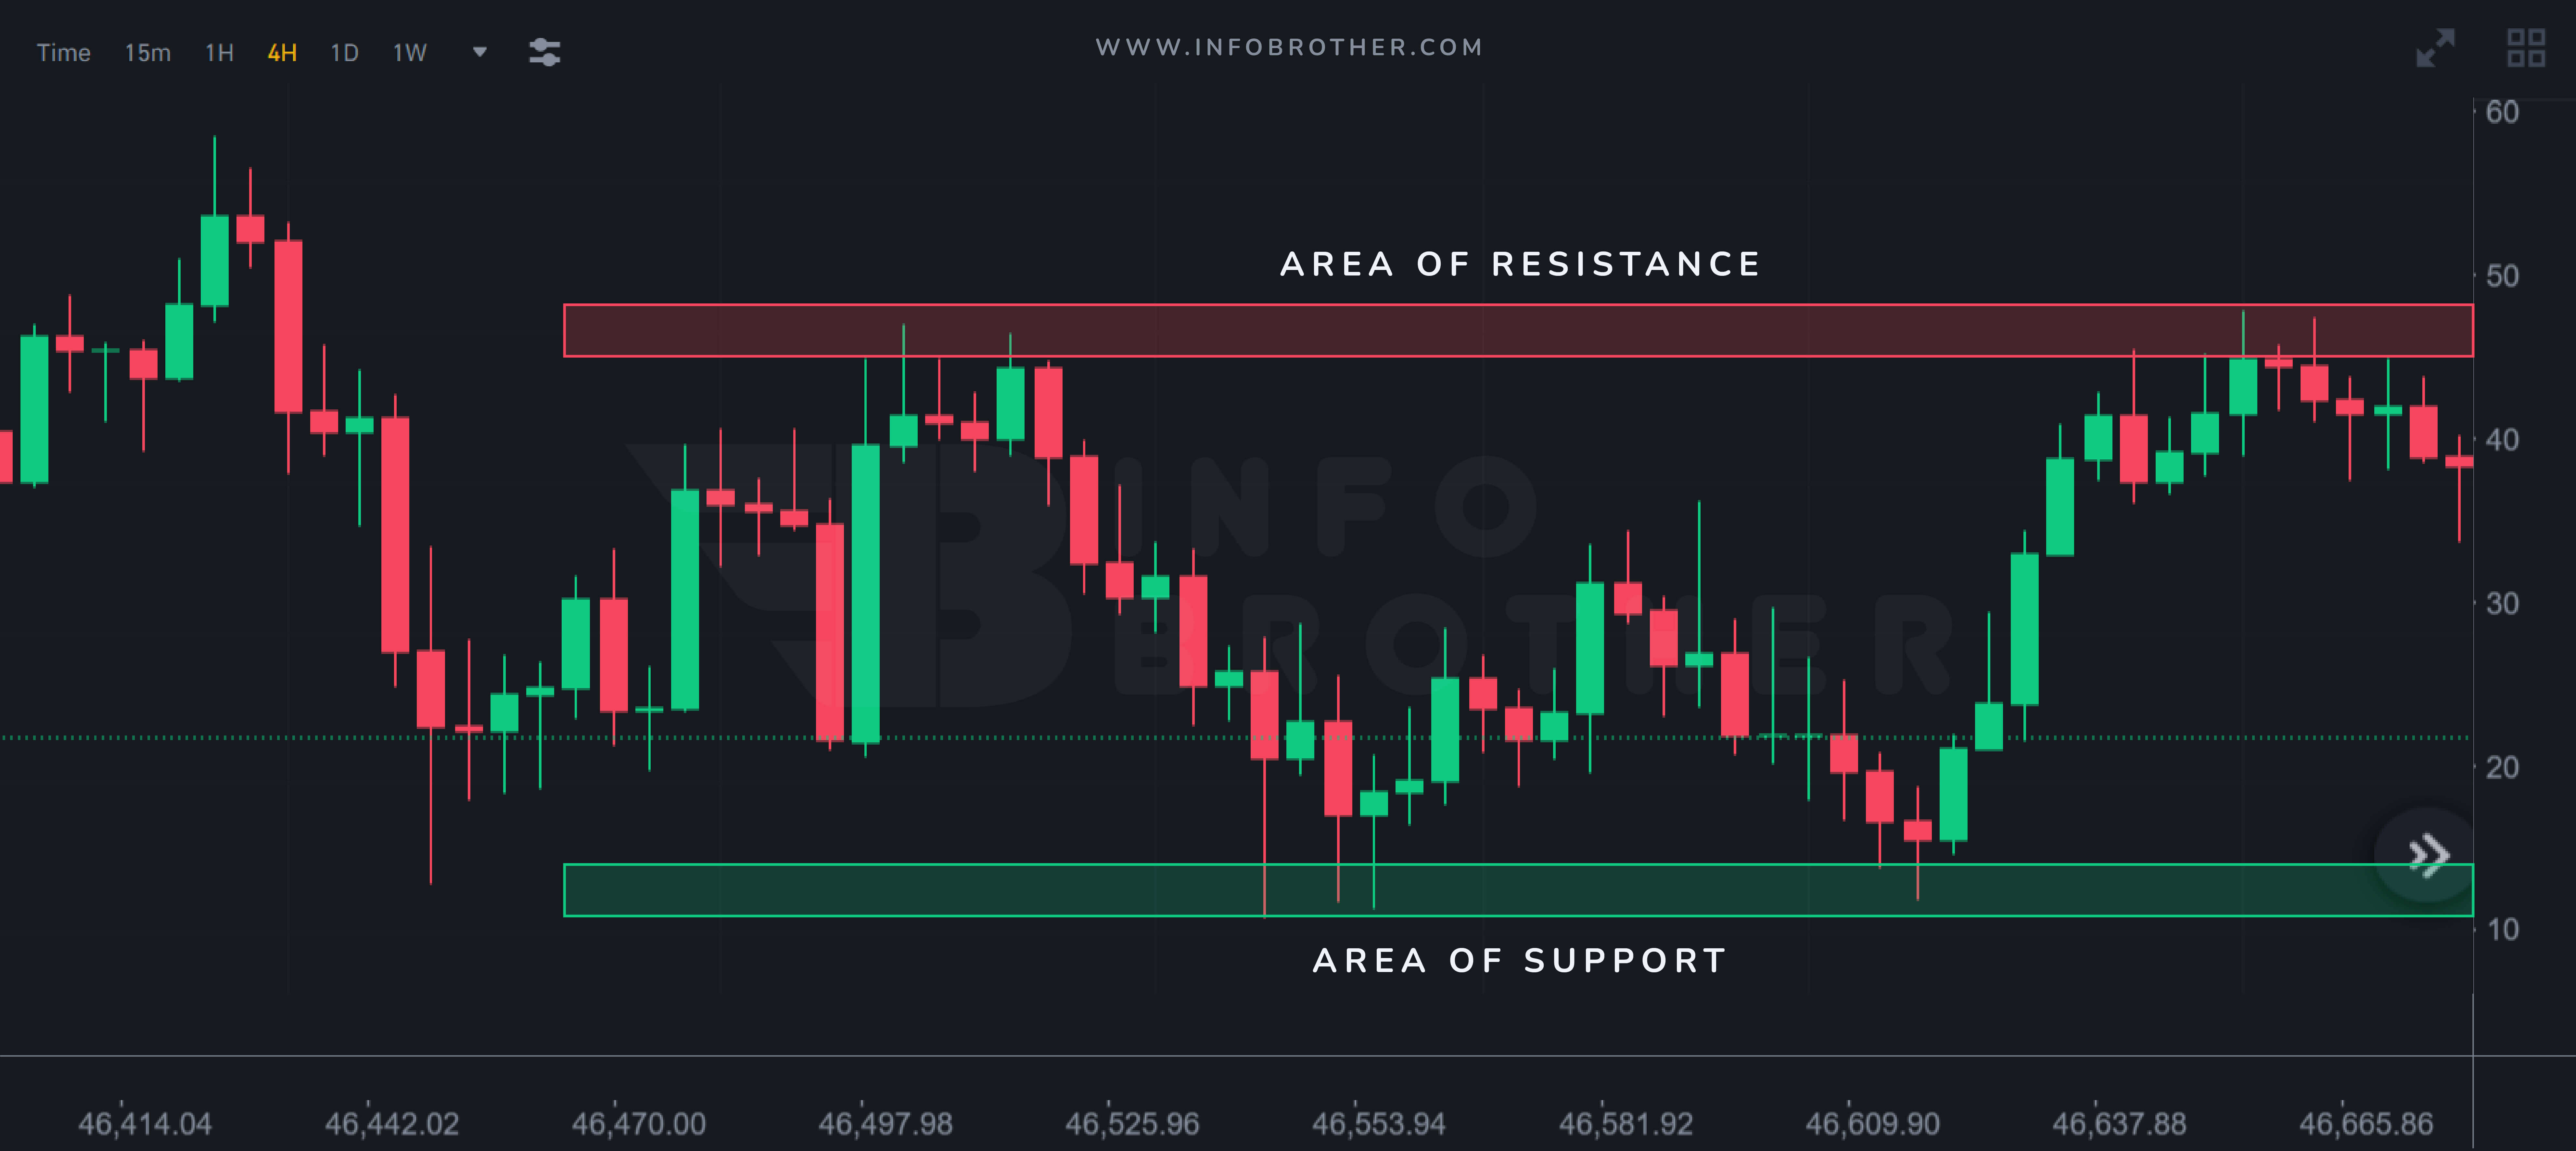
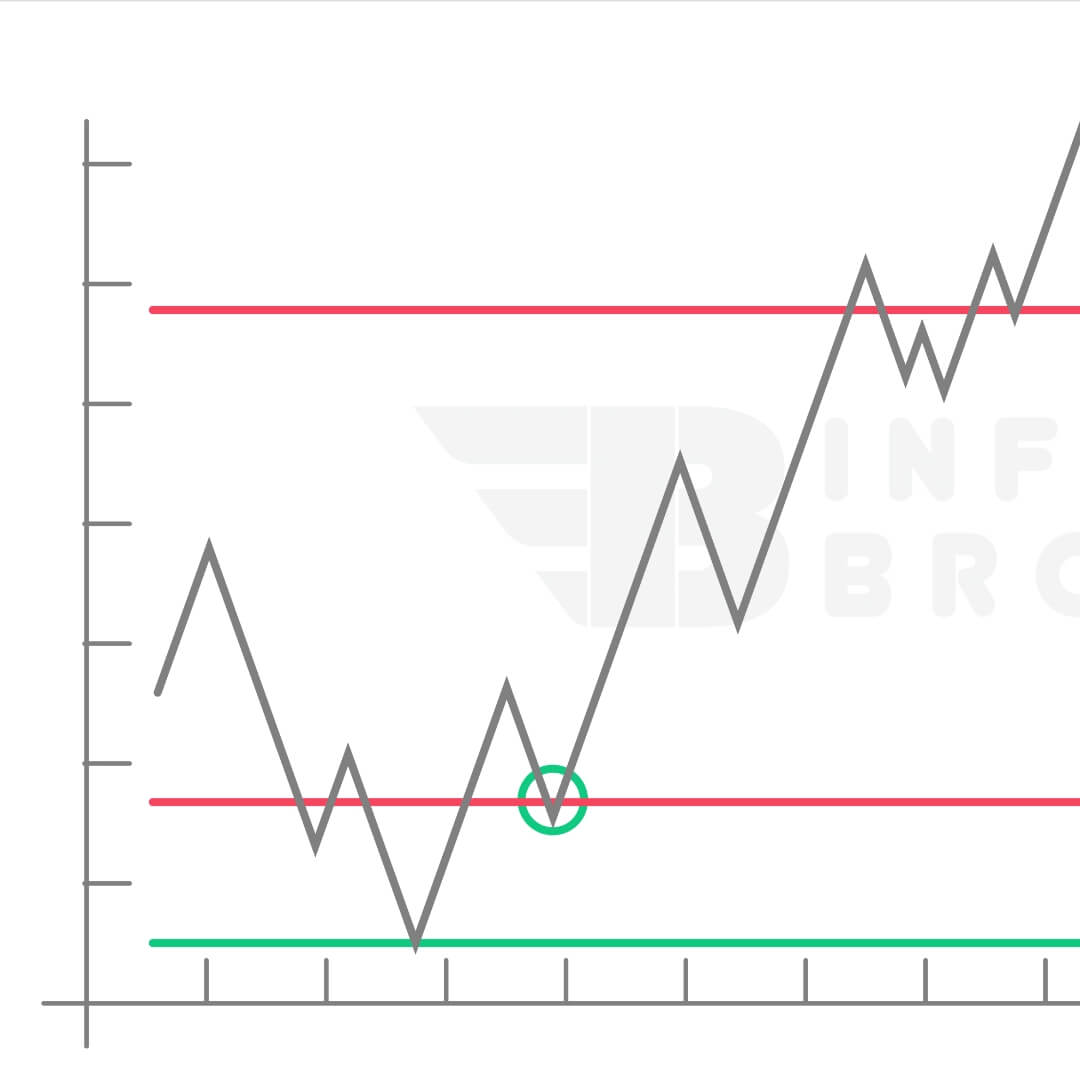
Trading level support and resistanceare two of the most talked-about aspects of technical analysis. These phrases are used by traders to refer to price levels on charts that operate as barriers, preventing the price of an asset from being pushed in a certain direction as part of evaluating chart patterns. We'll go into more detail on support and resistancein our upcoming post, but for now, a fundamental knowledge of the concepts will suffice.


  • SUPPORT: an area of value where potential buying pressure could step in and push the price higher.
  • RESISTANCE: an area of value where potential selling pressure could step in and push the price lower.
Moving average in crypto market

Moving average


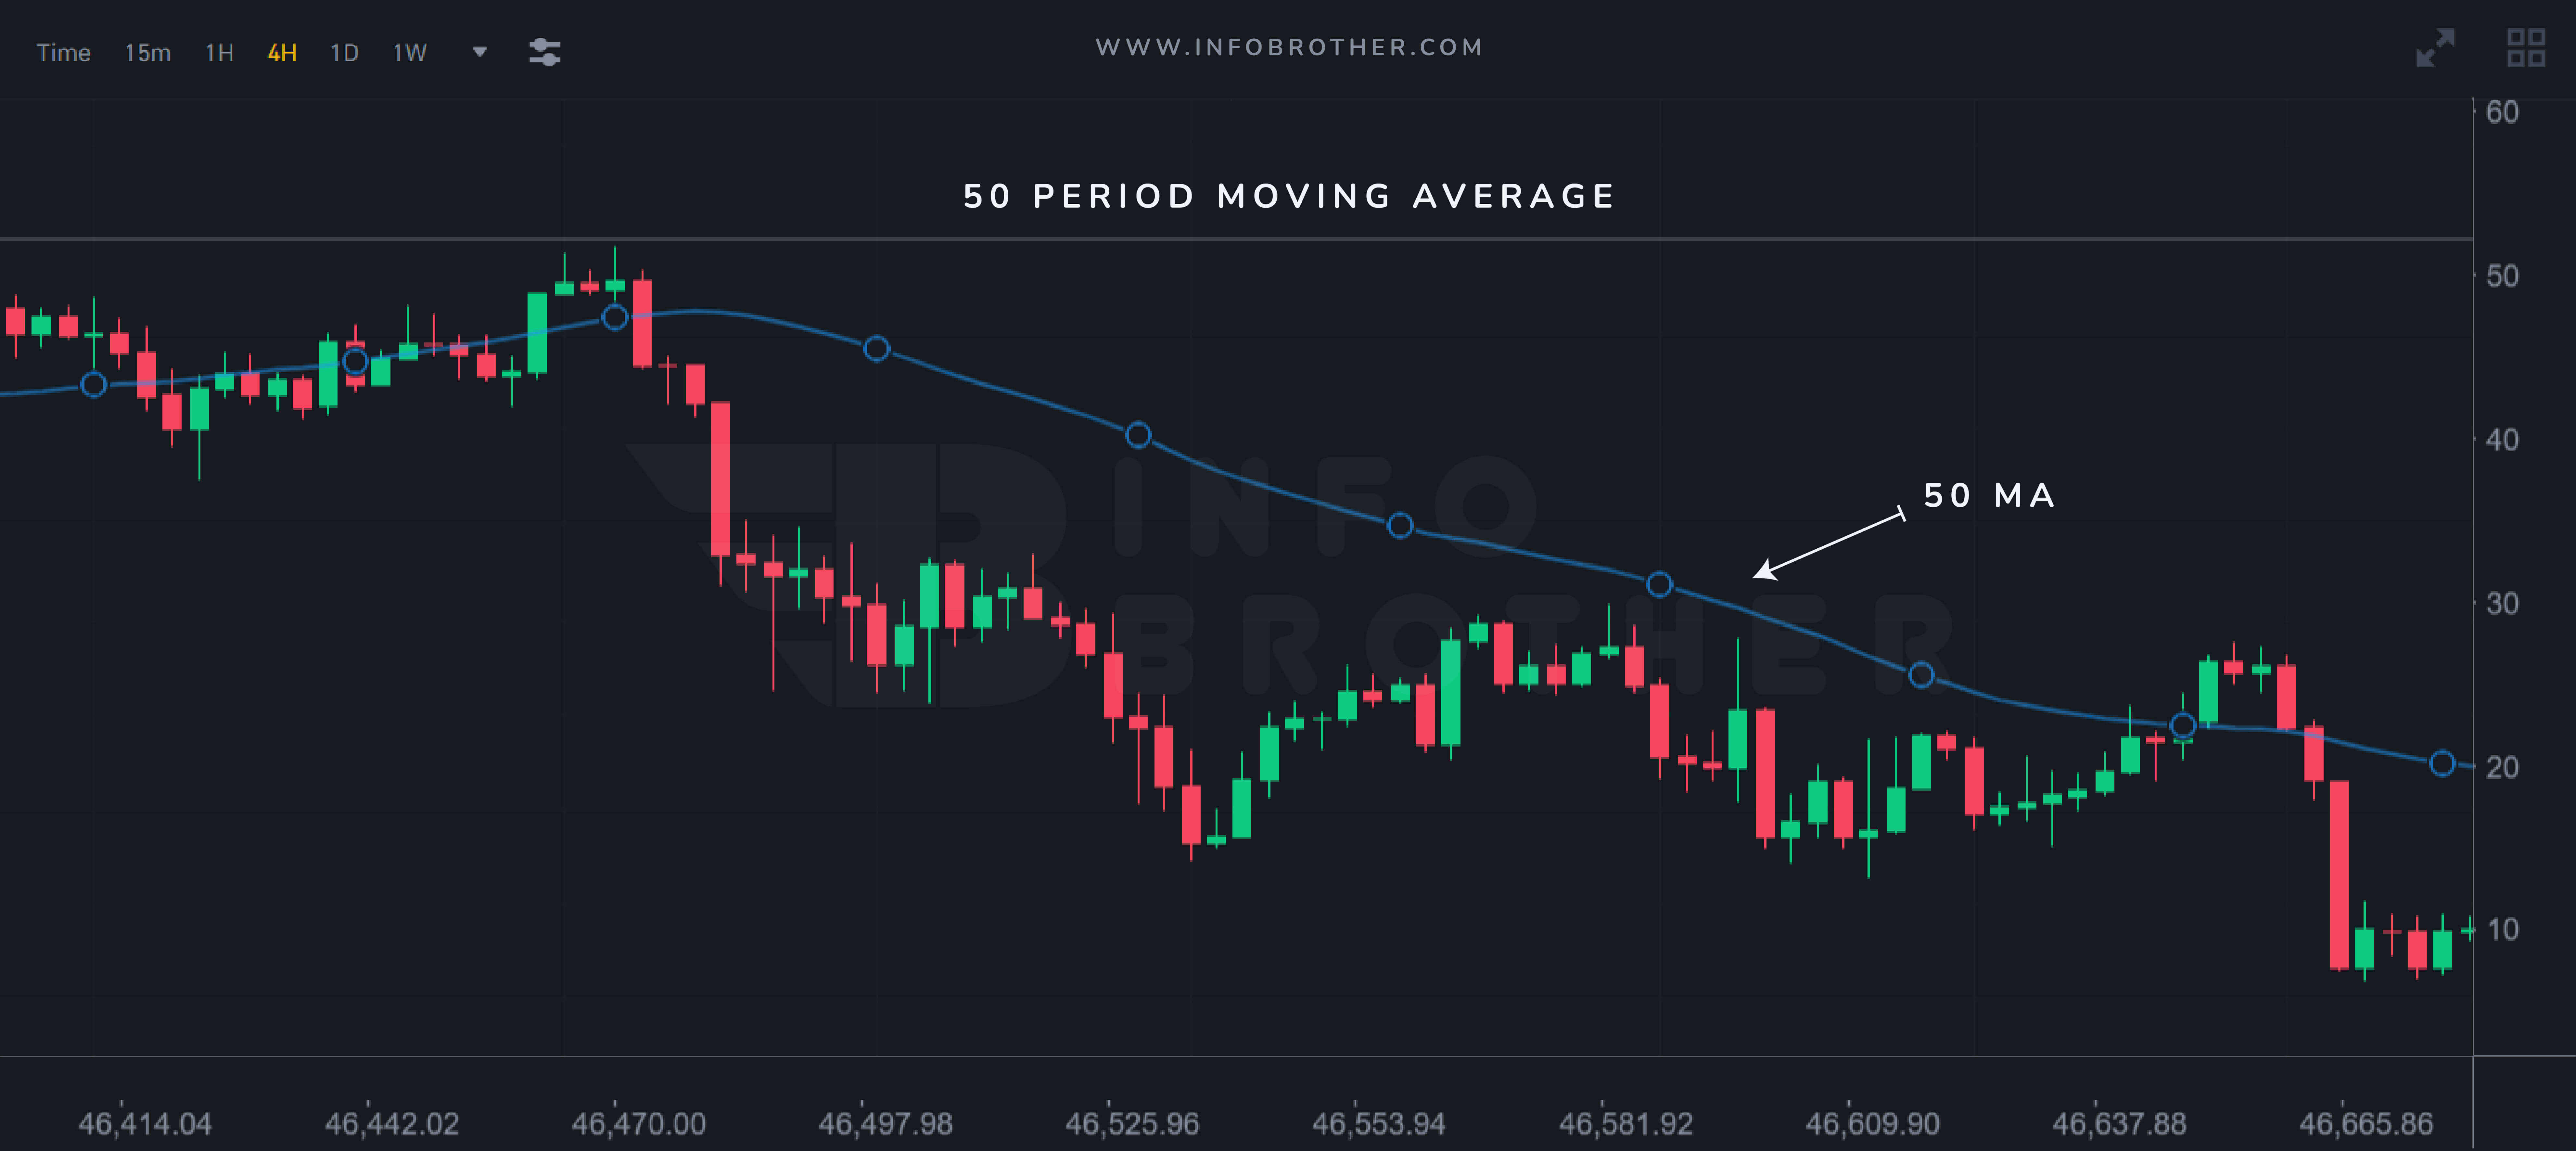
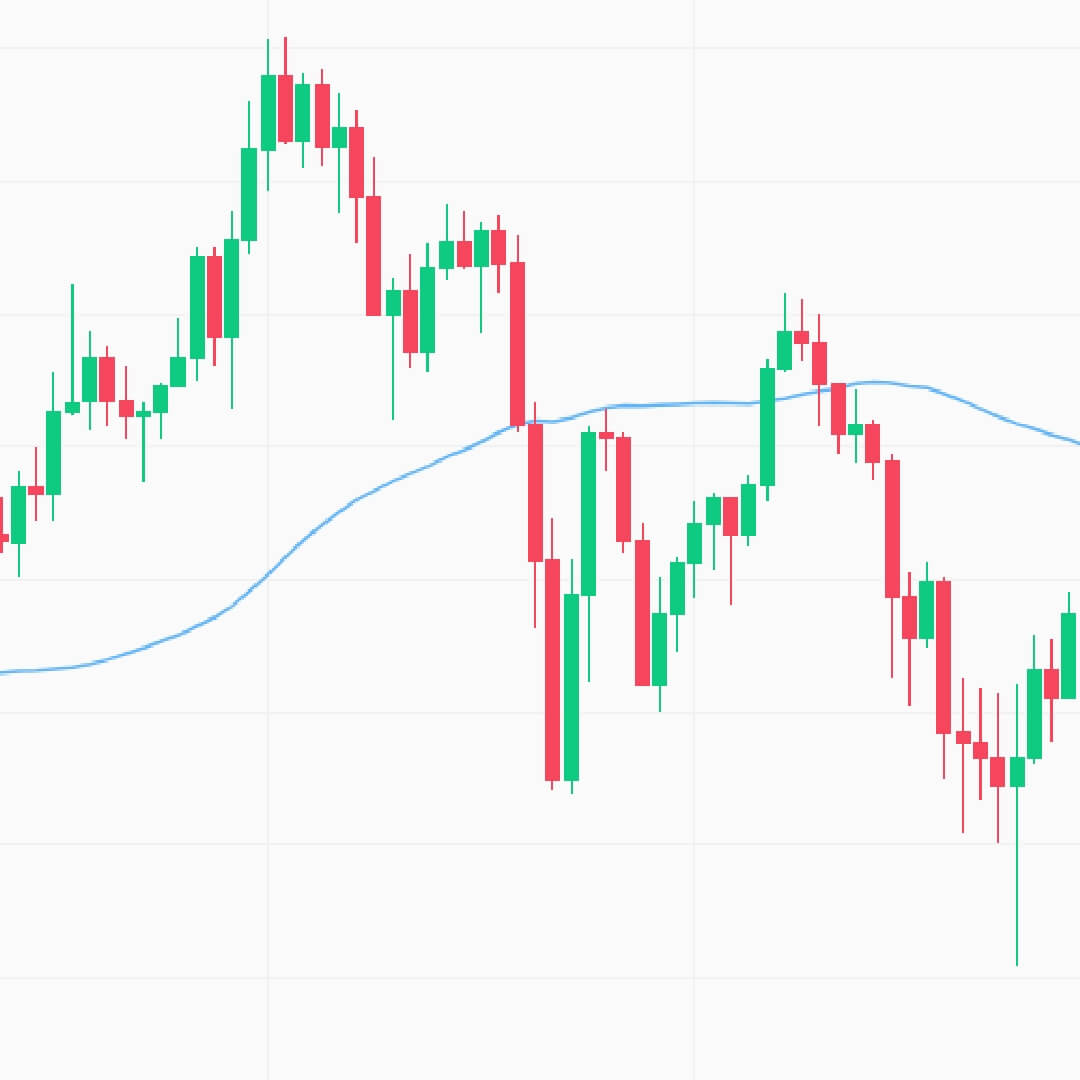
The moving average (MA) is a straightforward technical analysis technique that smooths out price data by calculating an average price that is continually updated. The average is calculated over a certain length of time, such as 10 days, 20 minutes, 30 weeks, or any other period selected by the trader.

When a market is trending, the price may respect the moving average as it searches for prospective buying or selling pressure, which works as a value area. It's not a bad idea to look for purchasing chances when the price retraces towards the moving average.

We've discovered that market structure determines whether we should buy, sell, or remain out of the market. The value area indicates where we should purchase and sell. The next thing we need to understand is "when we truly join the market and begin buying or selling."

'Entry trigger' is used to answer this question - So, what exactly is an entry trigger?

An entry trigger is a specific occurrence that assists us in determining market attitudes. It instructs us whether to enter or exit the transaction. It prevents us from entering or exiting trading too early or too late, skipping deals, or taking deals we shouldn't be doing.

When it comes to entry triggers, we have far too many strategies and tools to choose from. But I'll teach you how to utilize the greatest and easiest tool as your entry trigger right now. As an entrance trigger, we may utilize one of two methods.

Break of structure in cryptocurrency trading

Break of structure


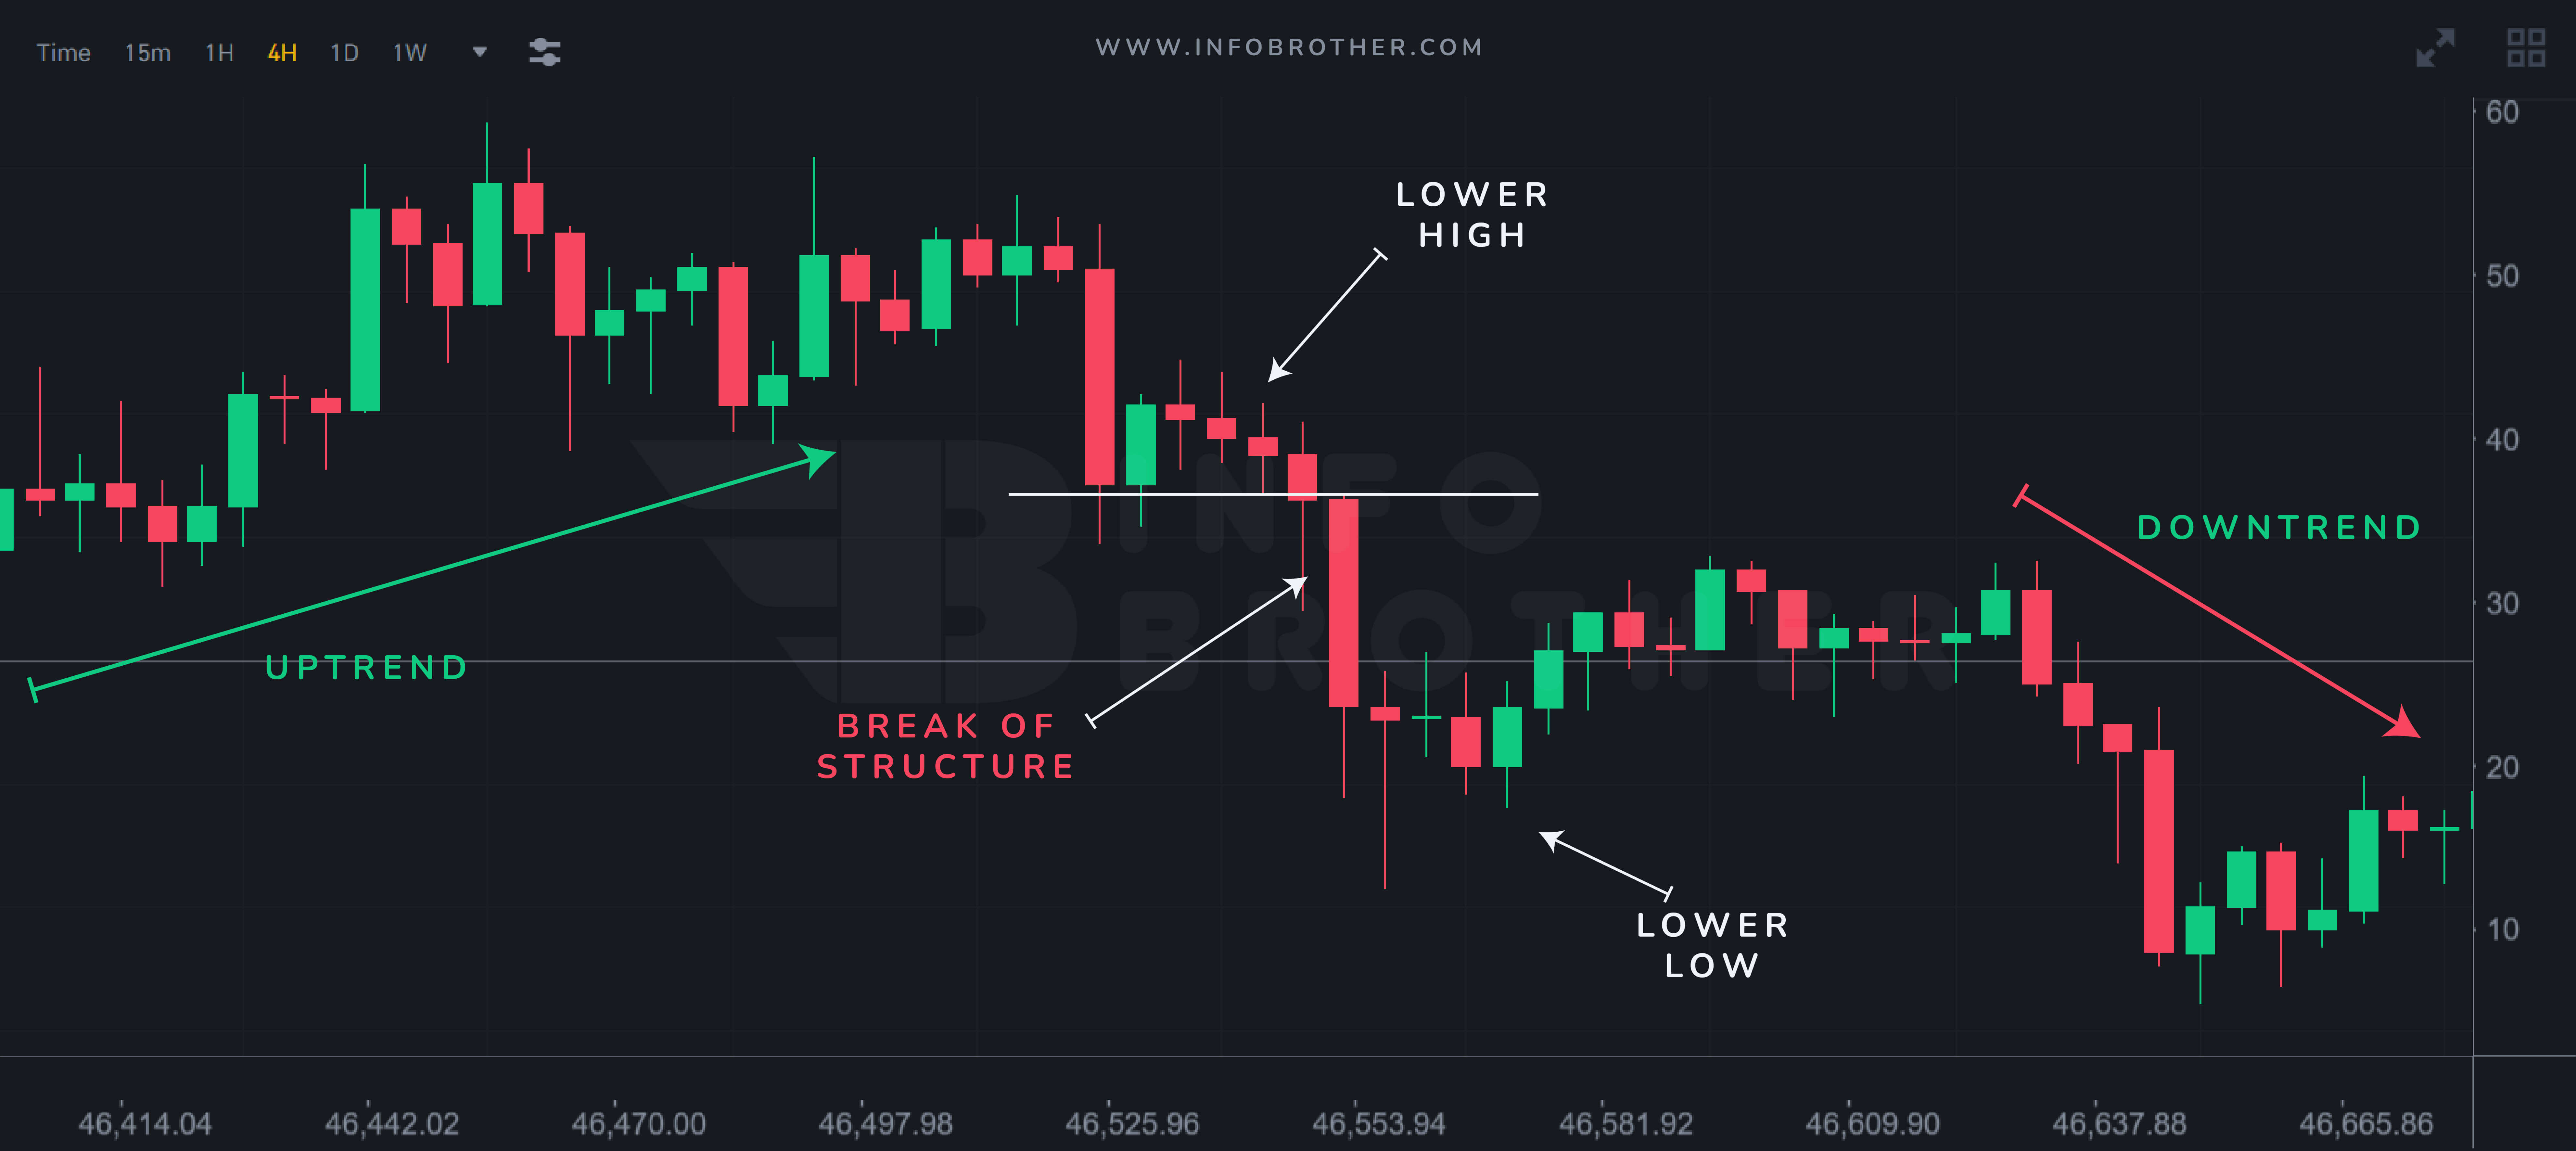
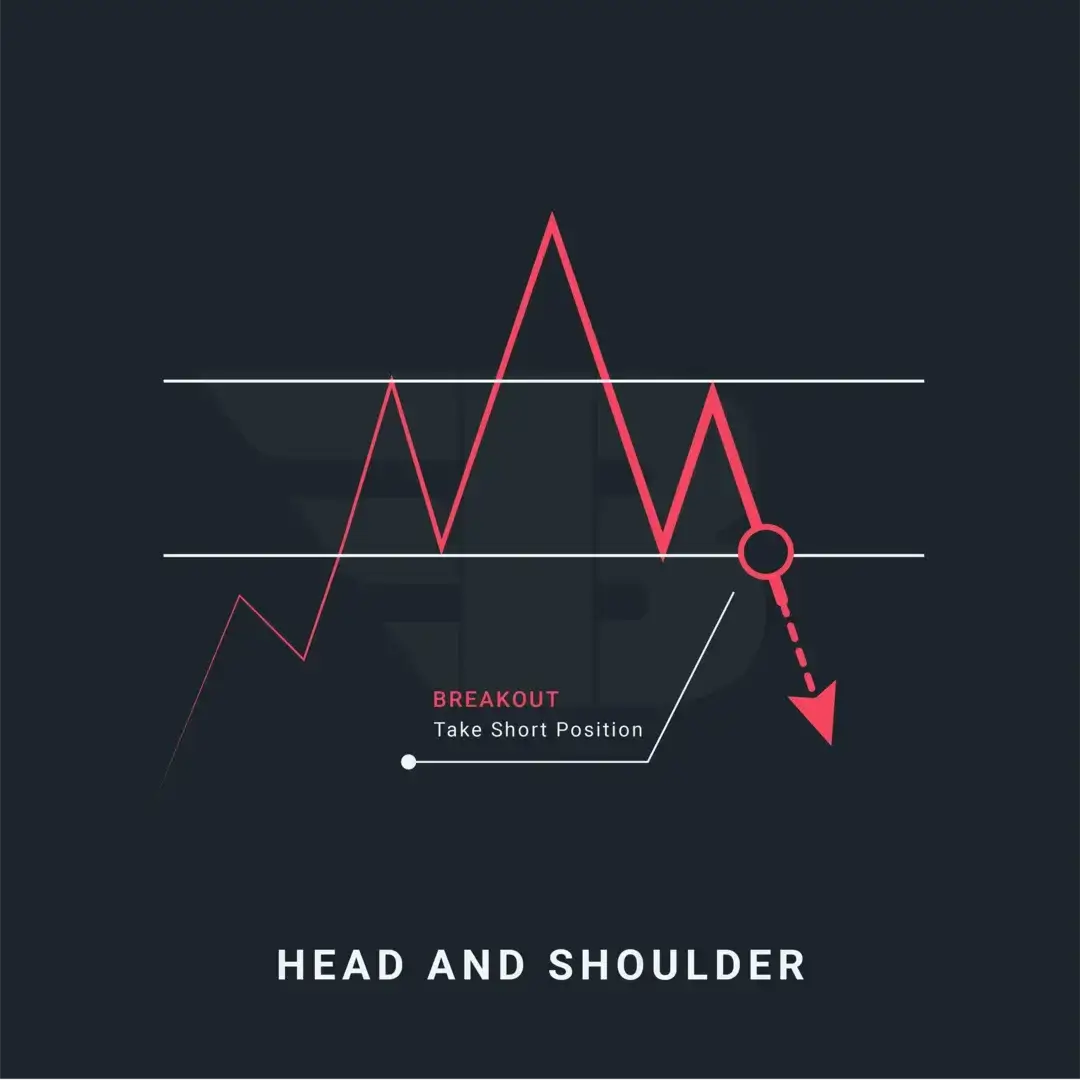
The structure break is a reversal price action pattern that enables us to enter the beginning of a new trend with little risk. Here are some things to watch for:

  • An upswing approaching resistance as seen over a longer period because we want the resistance area to pique the interest of sellers over the longer period,
  • The price fails to make a higher high but instead makes a lower high, providing us with a reference point for determining our stop loss.
  • Take a short position on the swing low or support break.

False Break


A false break is a reversal price action pattern that allows us to buy low and sell high. Some things to keep an eye out for are:

  • Look for a strong bullish trend into resistance; larger candles are better.
  • Allow the price to break over the resistance's extreme highs, causing additional traders to purchase the breakout.
  • Look for a false break pattern in which the price reverses abruptly and closes below resistance.
  • Enter a short position at the opening of the next candle.
how to add stop loss in trading

We've learned how to assess market structure, what area of value is and how to calculate it, and how to utilize the entry trigger to enter or exit a trade. Even with all of this information, a loser may emerge. That is why knowing when to exit our deal before things deteriorate is critical.

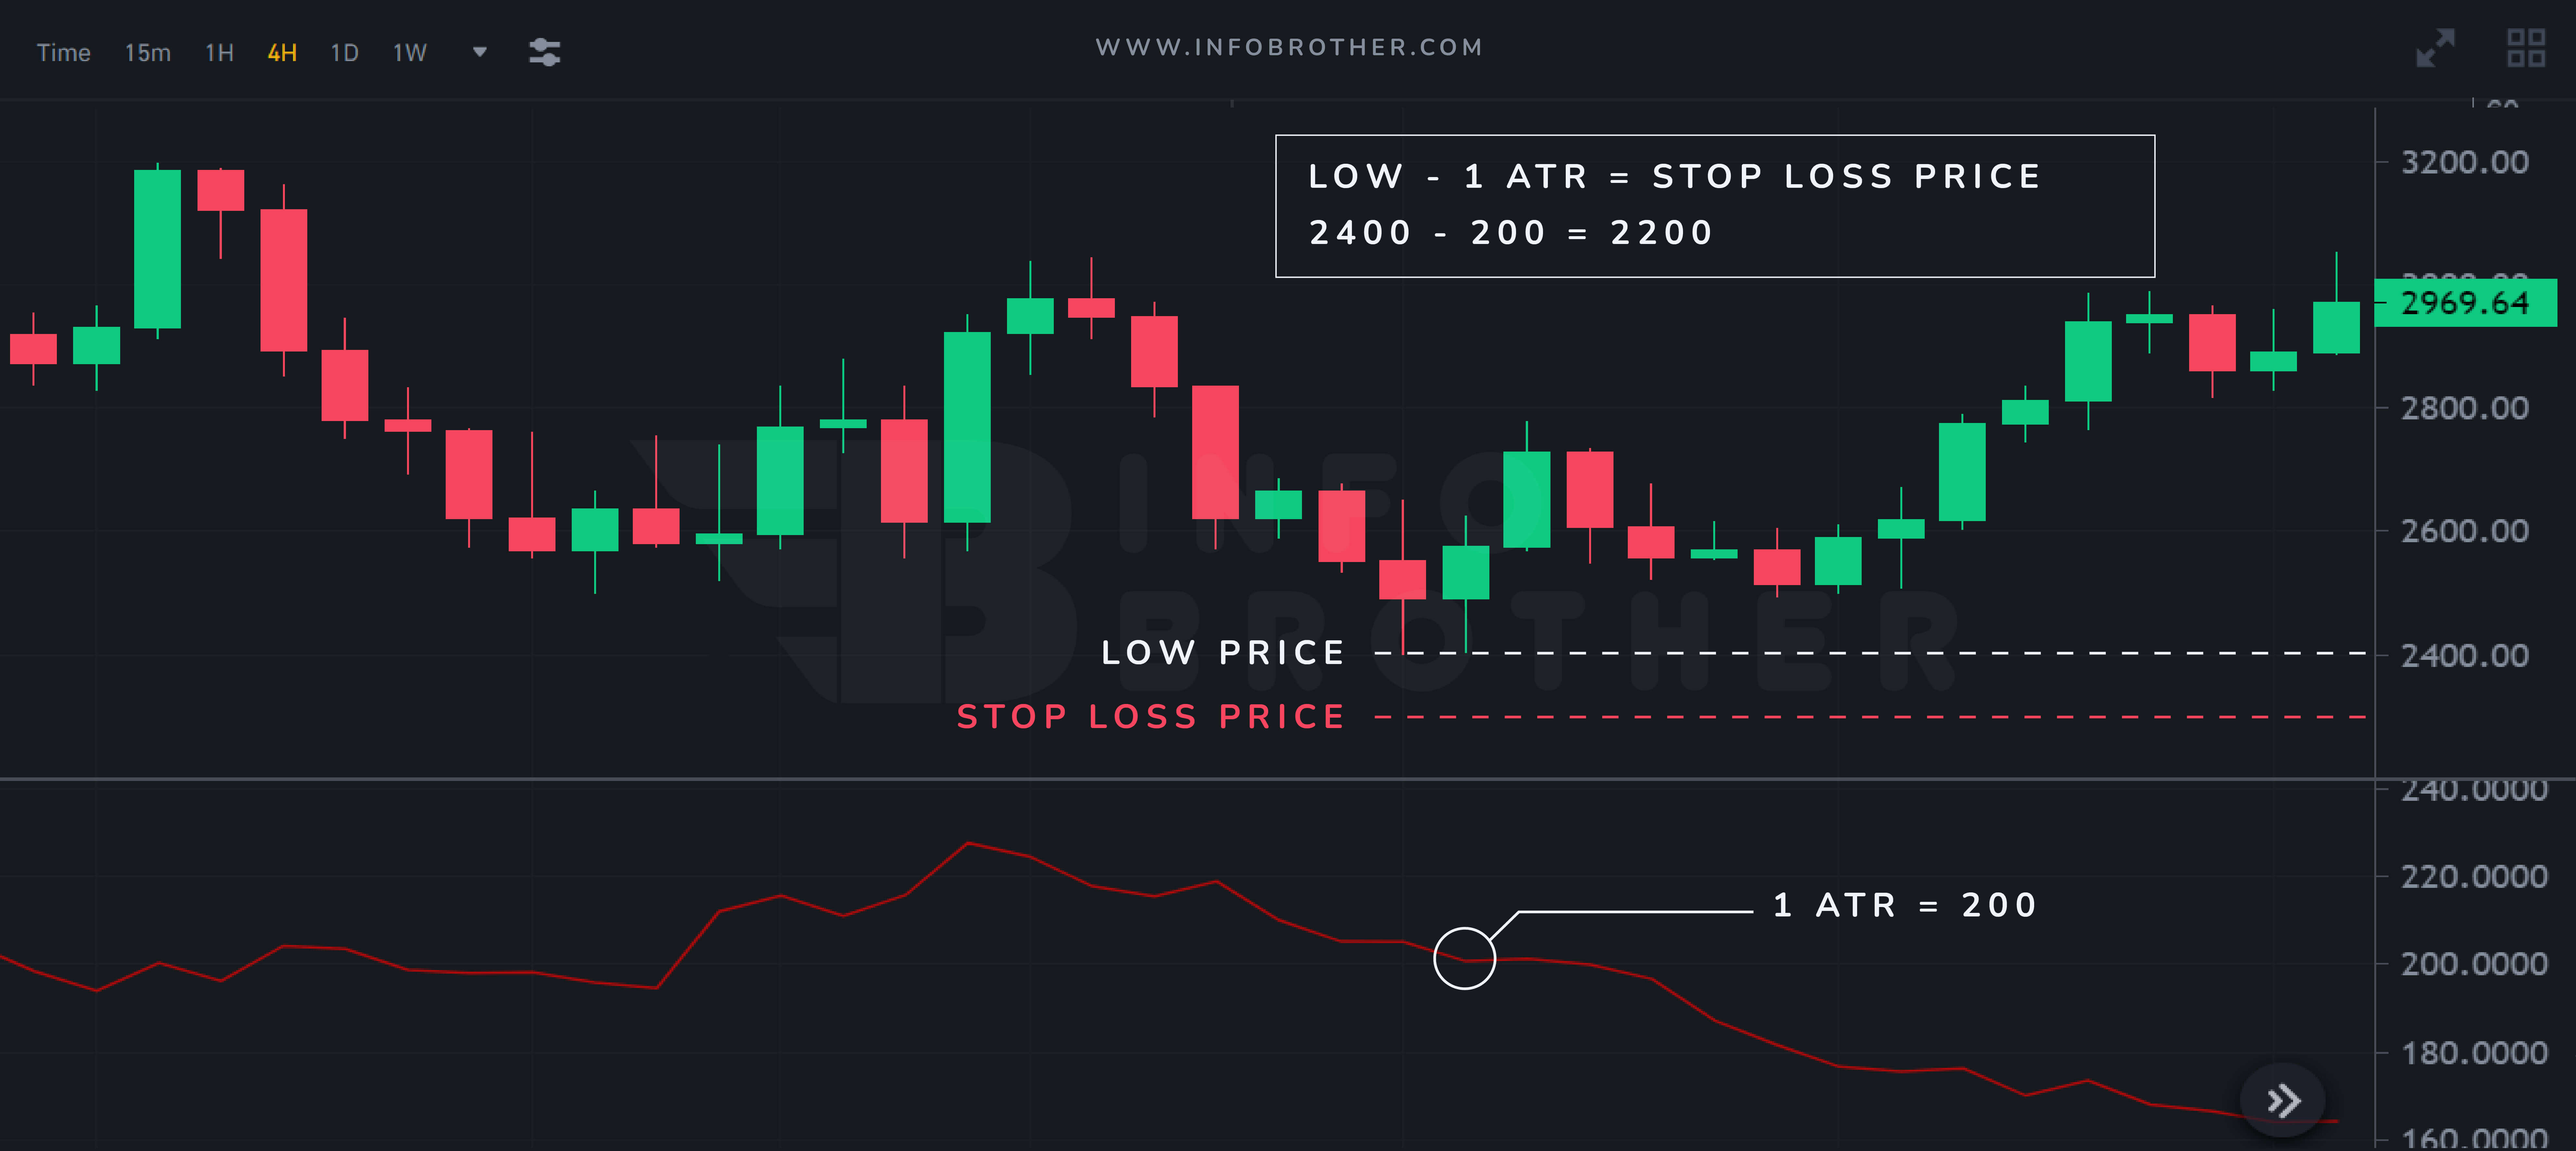
In this scenario, our last tool, the "stop-loss," is used to safeguard our trading account from losing all of our money on a single deal. So, where should our stop loss be placed?

Simply put, our stop loss should be placed at a level that will invalidate or remove our trading strategy if the price reaches it. If we purchase at support and anticipate buying pressure to drive the price higher, our stop loss should be below the support region. If the price falls below the support level in this situation, it indicates that our assumptions were incorrect, and we should exit the trade before it becomes too late.

So, should we put our stop loss beneath the support area or leave it some breathing room? To avoid stop hunting, we need to give it a 1 ATR (Average True Range) buffer below support.

The Average True Range (ATR) :

The Average True Range (ATR) is a volatility measurement technique used in technical analysis. Unlike many other prominent indicators today, the ATR does not predict price direction. It is, instead, a statistic that is primarily used to assess volatility, particularly volatility induced by price gaps or limit changes.

Follow these procedures to place a stop-loss order.

  • In the support area, find the lowest low.
  • Find out what the ATR value is right now.
  • Subtract the current ATR value from the lowest price of support - Our stop-loss limit will be the solution.

This technique may be used for any kind of value area, not simply support and resistance. If we purchase near a moving average in the hopes of seeing buying pressure, our stop loss should be below the moving average. Because if the price falls below it, the moving average will no longer be "regarded," invalidating our trading strategy.

Here's what we found out:

  • The market structure determines whether we should purchase, sell, or stay away from the markets.
  • We may utilize a value region, such as support and resistance or a moving average, to help us determine where to buy or sell.
  • A price trend entry signal, such as price rejection or candlestick patterns, advises us when to buy or sell.
  • We should set our stop loss at a level that, if reached or when our value area is "destroyed," will render our trading arrangement null and void.


Selected Reading

Up to 20% Off

Limited Time Offer

Save money by downloading products with up to a 20% discount.Hurry up!

Download Now