Trading Support and Resistance
4 Proven Strategies for Trading Support and Resistance Levels
Support and Resistance are two of the most fundamental and actionable concepts in technical analysis. Many other parts of technical analysis, such as price patterns, are built on the fundamental ideas of support and resistance. In this article, we will look at the top four support and resistance trading tactics for trading a market as it moves from a strong swing high or low.

Understanding the levels of support and resistance on a price chart may help you determine whether to buy or sell at a certain price. The support price is the price at which there will be more demand than supply. The support level is the price on the chart at which traders anticipate the greatest amount of demand for a stock in terms of buying.
On a candlestick chart, the resistance level is the price at which more sellers than buyers are predicted. It prohibits the price from increasing any further, and a resistance level is a price point on the chart at which traders anticipate the greatest amount of selling supply for a certain asset.
Support and resistance is a technical analysis concept that claims that when the price of a stock hits a certain price level, it generally stops and proceeds in the opposite direction.
As we all know, a trend linemay be utilized to identify potential buying or selling opportunities. This method, however, is only effective if the market continues to utilize the trend line as support or resistance. So, what if the market no longer adheres to the level?
When a market transitions from a large swing high or low, we have the chance to trade it. The top four support and resistance trading methods are as follows:
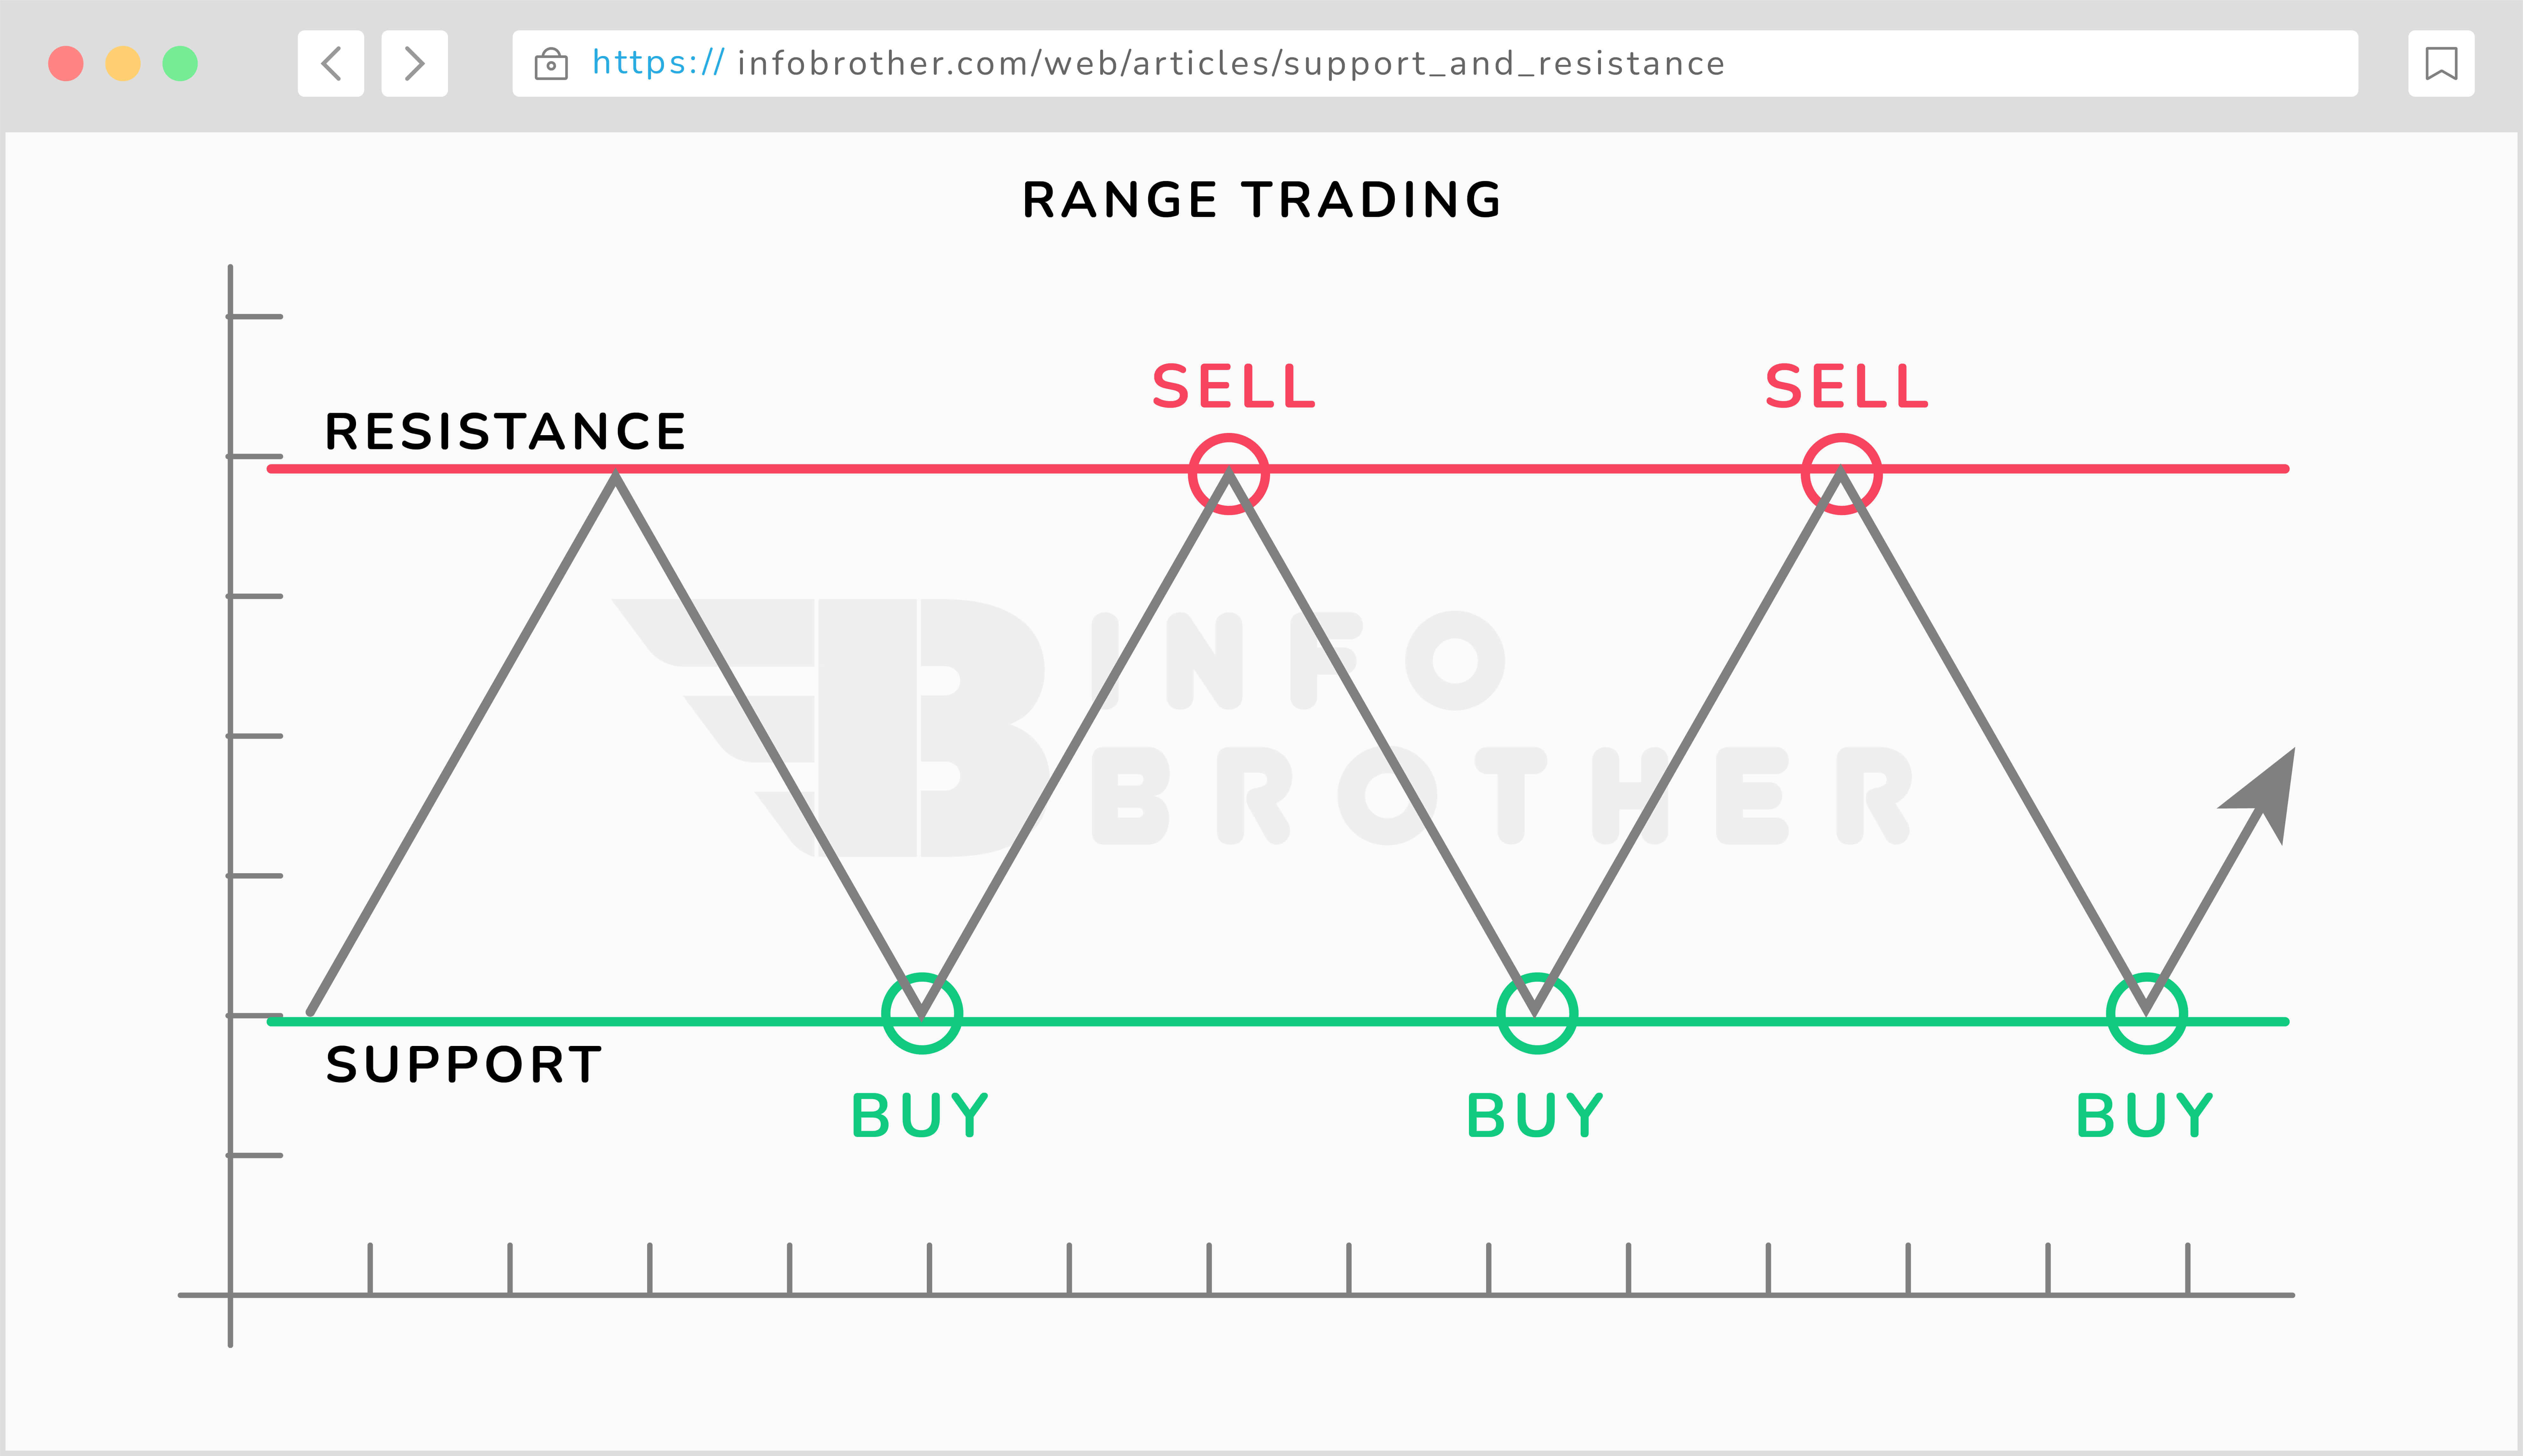
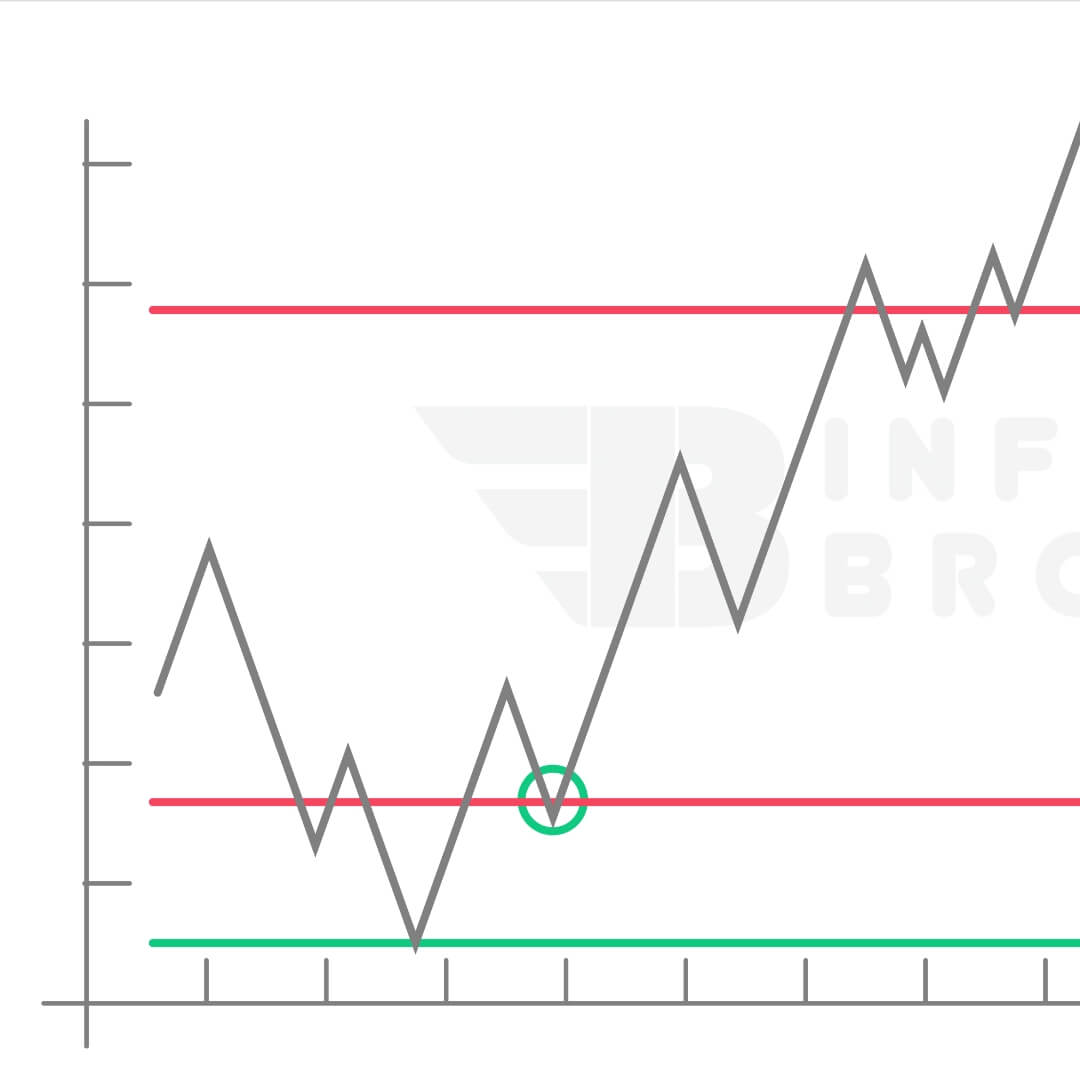
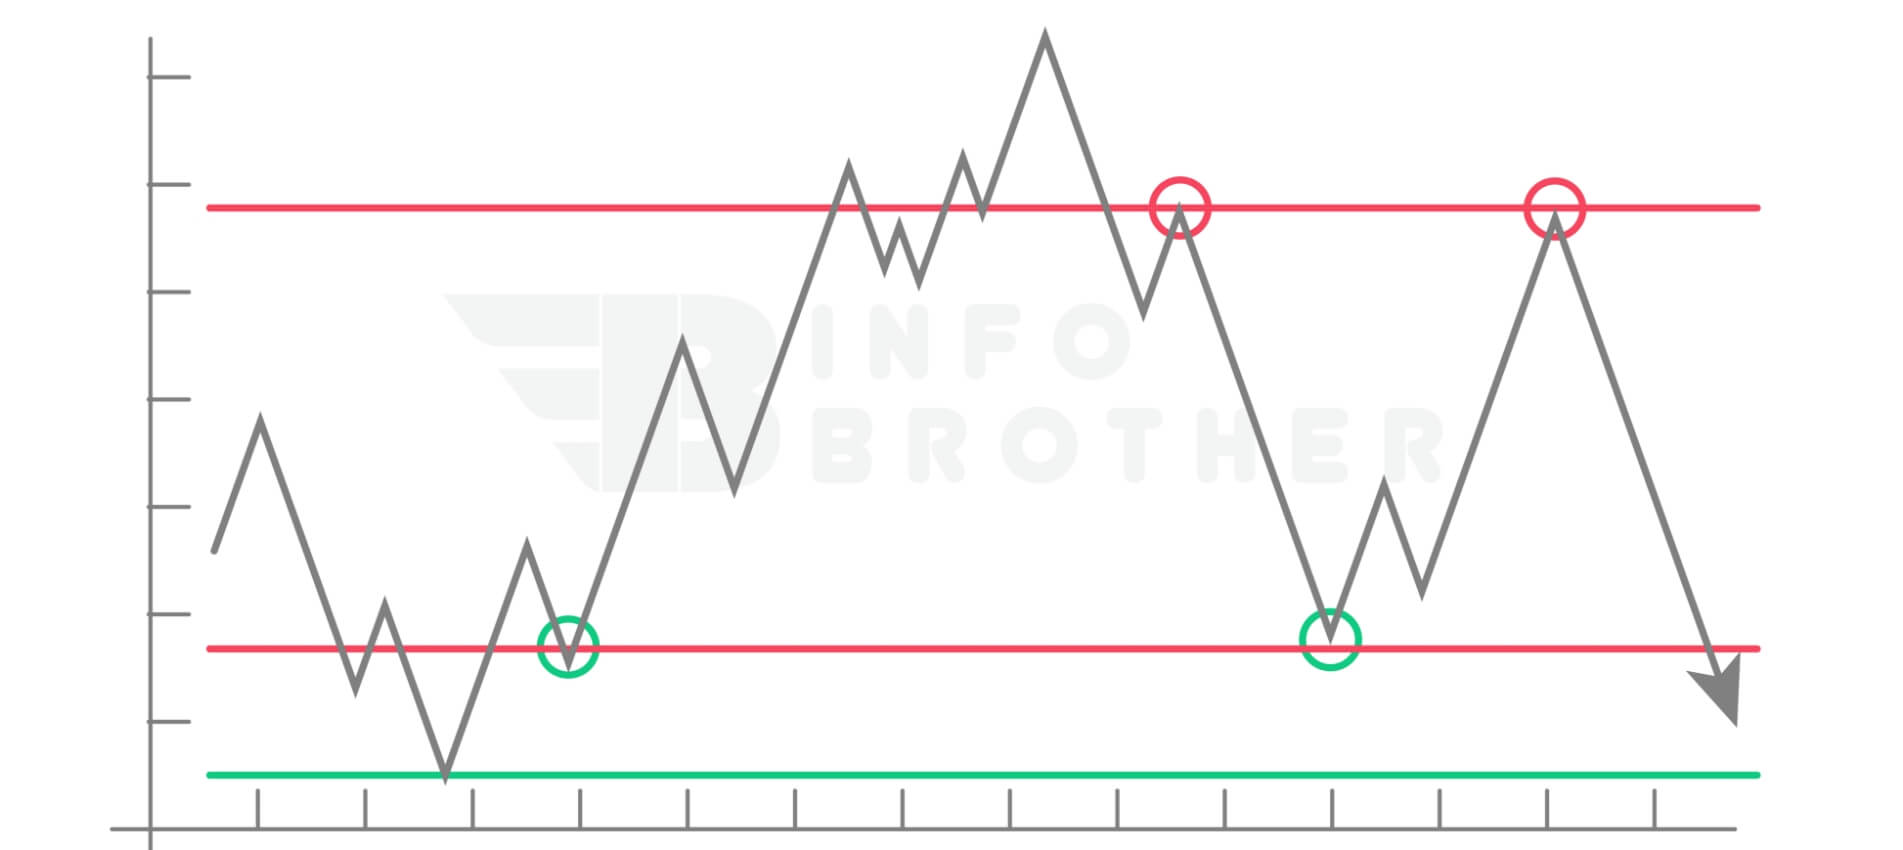
Range trading takes place in the area between support and resistance, with traders seeking to buy at support and sell at resistance. Consider the area between support and resistance to be a room. The base provides support, but the ceiling provides resistance. Ranges are prevalent in sideways trading conditions when there is no clear indication of a trend.
Here are some important factors to consider while investing in the range market.
- Support and resistance levels are not always exactly straight lines. Price may occasionally bounce off a particular spot rather than a fully straight line.
- Traders must identify a trading range and, as a consequence, areas of support and resistance. The zone of support and resistance may be identified and is represented in the above image.
- When the market is range-bound, traders look for long entry off support and short entries off resistance.
- Price has not always maintained the borders of support and resistance, therefore traders may consider putting their stop-loss below the support when long and above the resistance when short.
It's important to understand the legitimate and fake trade movements. A false breakout can be a sign that the price is entering a new trading range, or it could be an early insight into a fakeout, which we often refer to as a "fake move". You should always use sound risk management to mitigate the potential for negative risk when you experience this type of market movement.
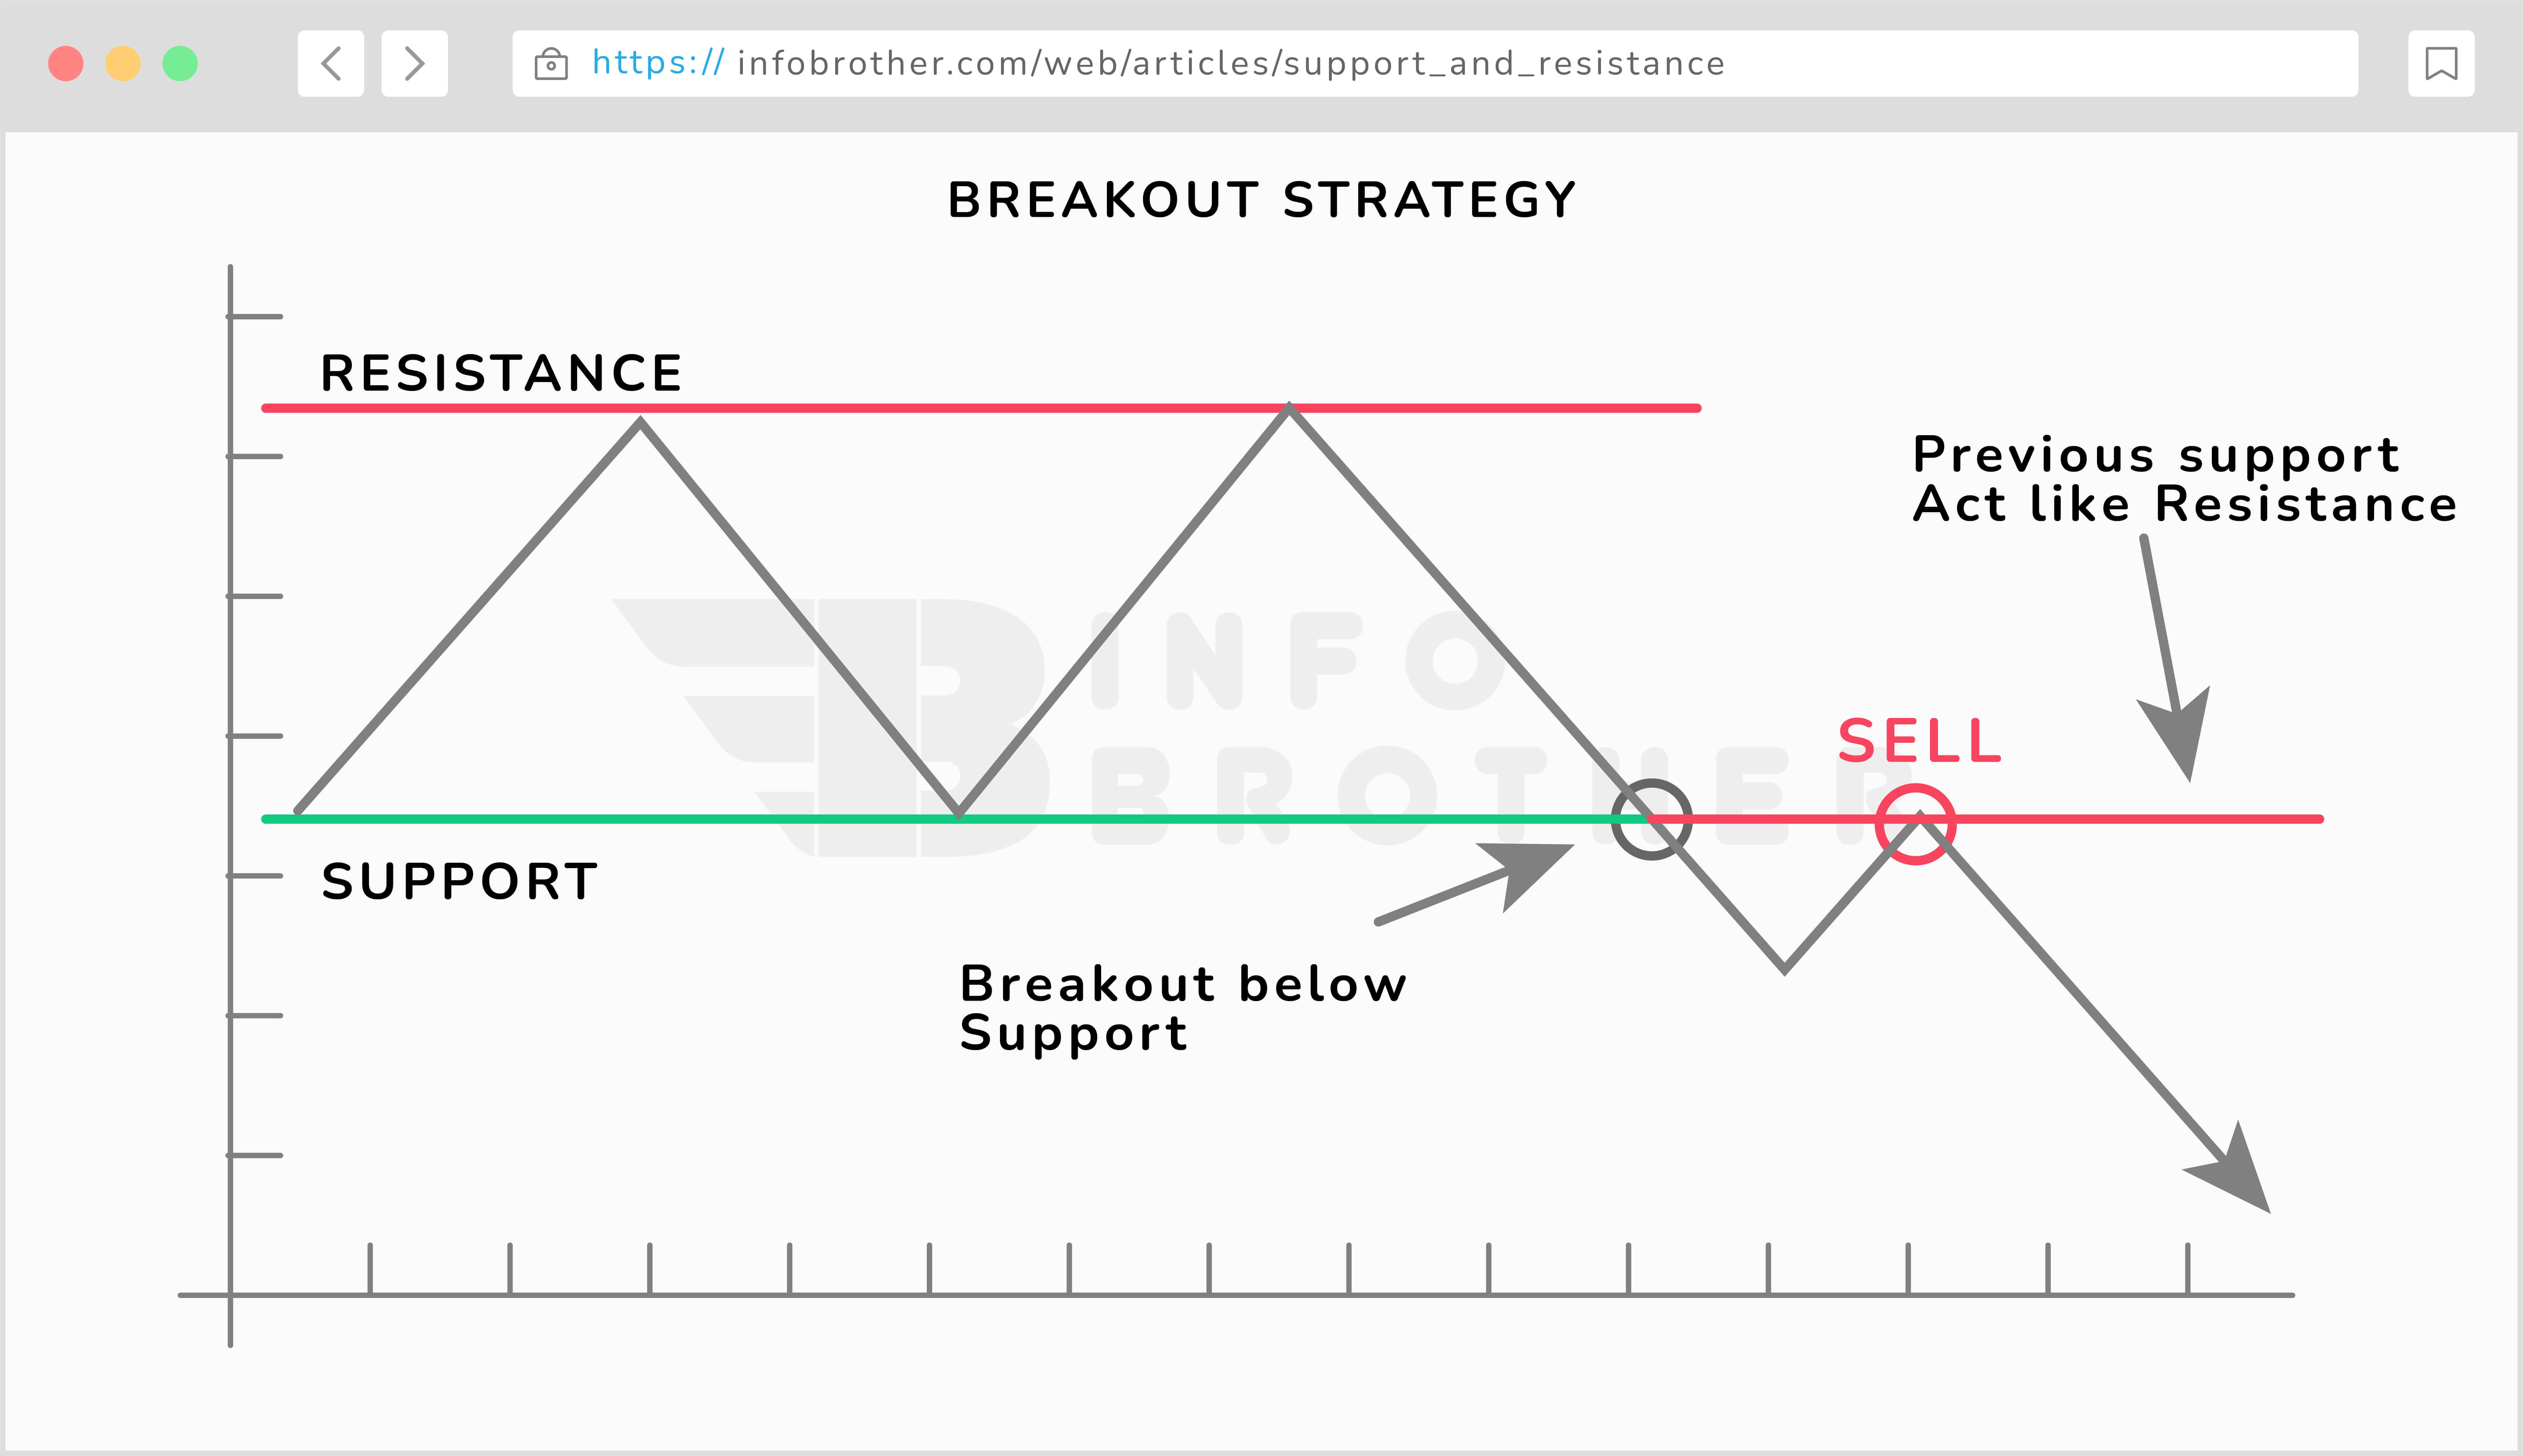
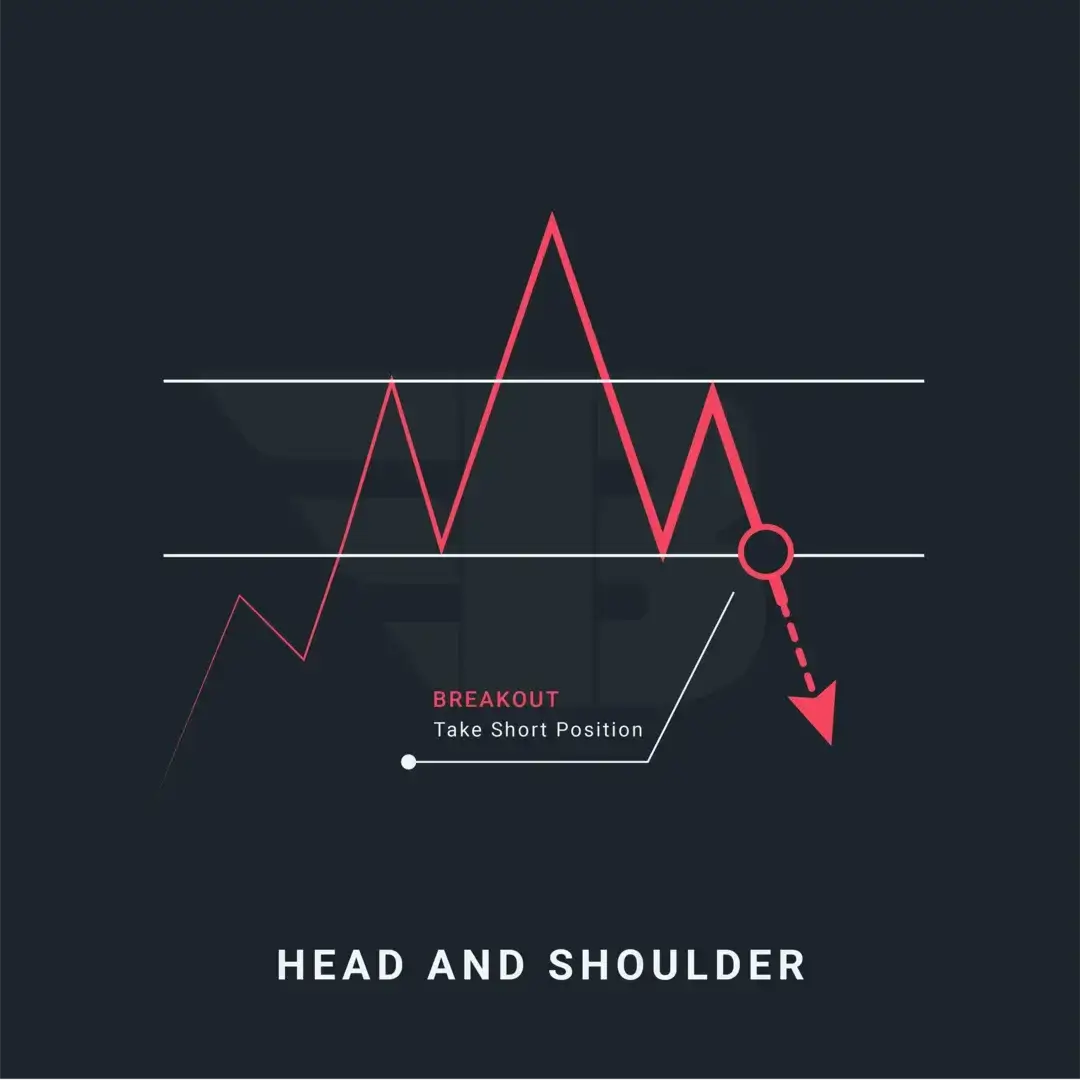
After a period of directional hesitation, prices will frequently breakout and begin moving. Traders frequently keep an eye out for such breaches below or over support in order to profit from increased momentum in one direction. If the current trend continues, it has the potential to launch a new one.
Top traders, on the other hand, like to wait for a pullback (towards support or resistance) before placing a trade in order to avoid trading a false breakout.
For example, the chart above shows a large level of support before sellers drove the price below support. Many traders may become fascinated and rush to start a quick deal. Rather, before making a short trade, traders should wait for the market reaction (buyers wanting to gain control) to break down.
In this instance, traders should wait for the market to restart its downward trend after a pullback before looking for entry opportunities.
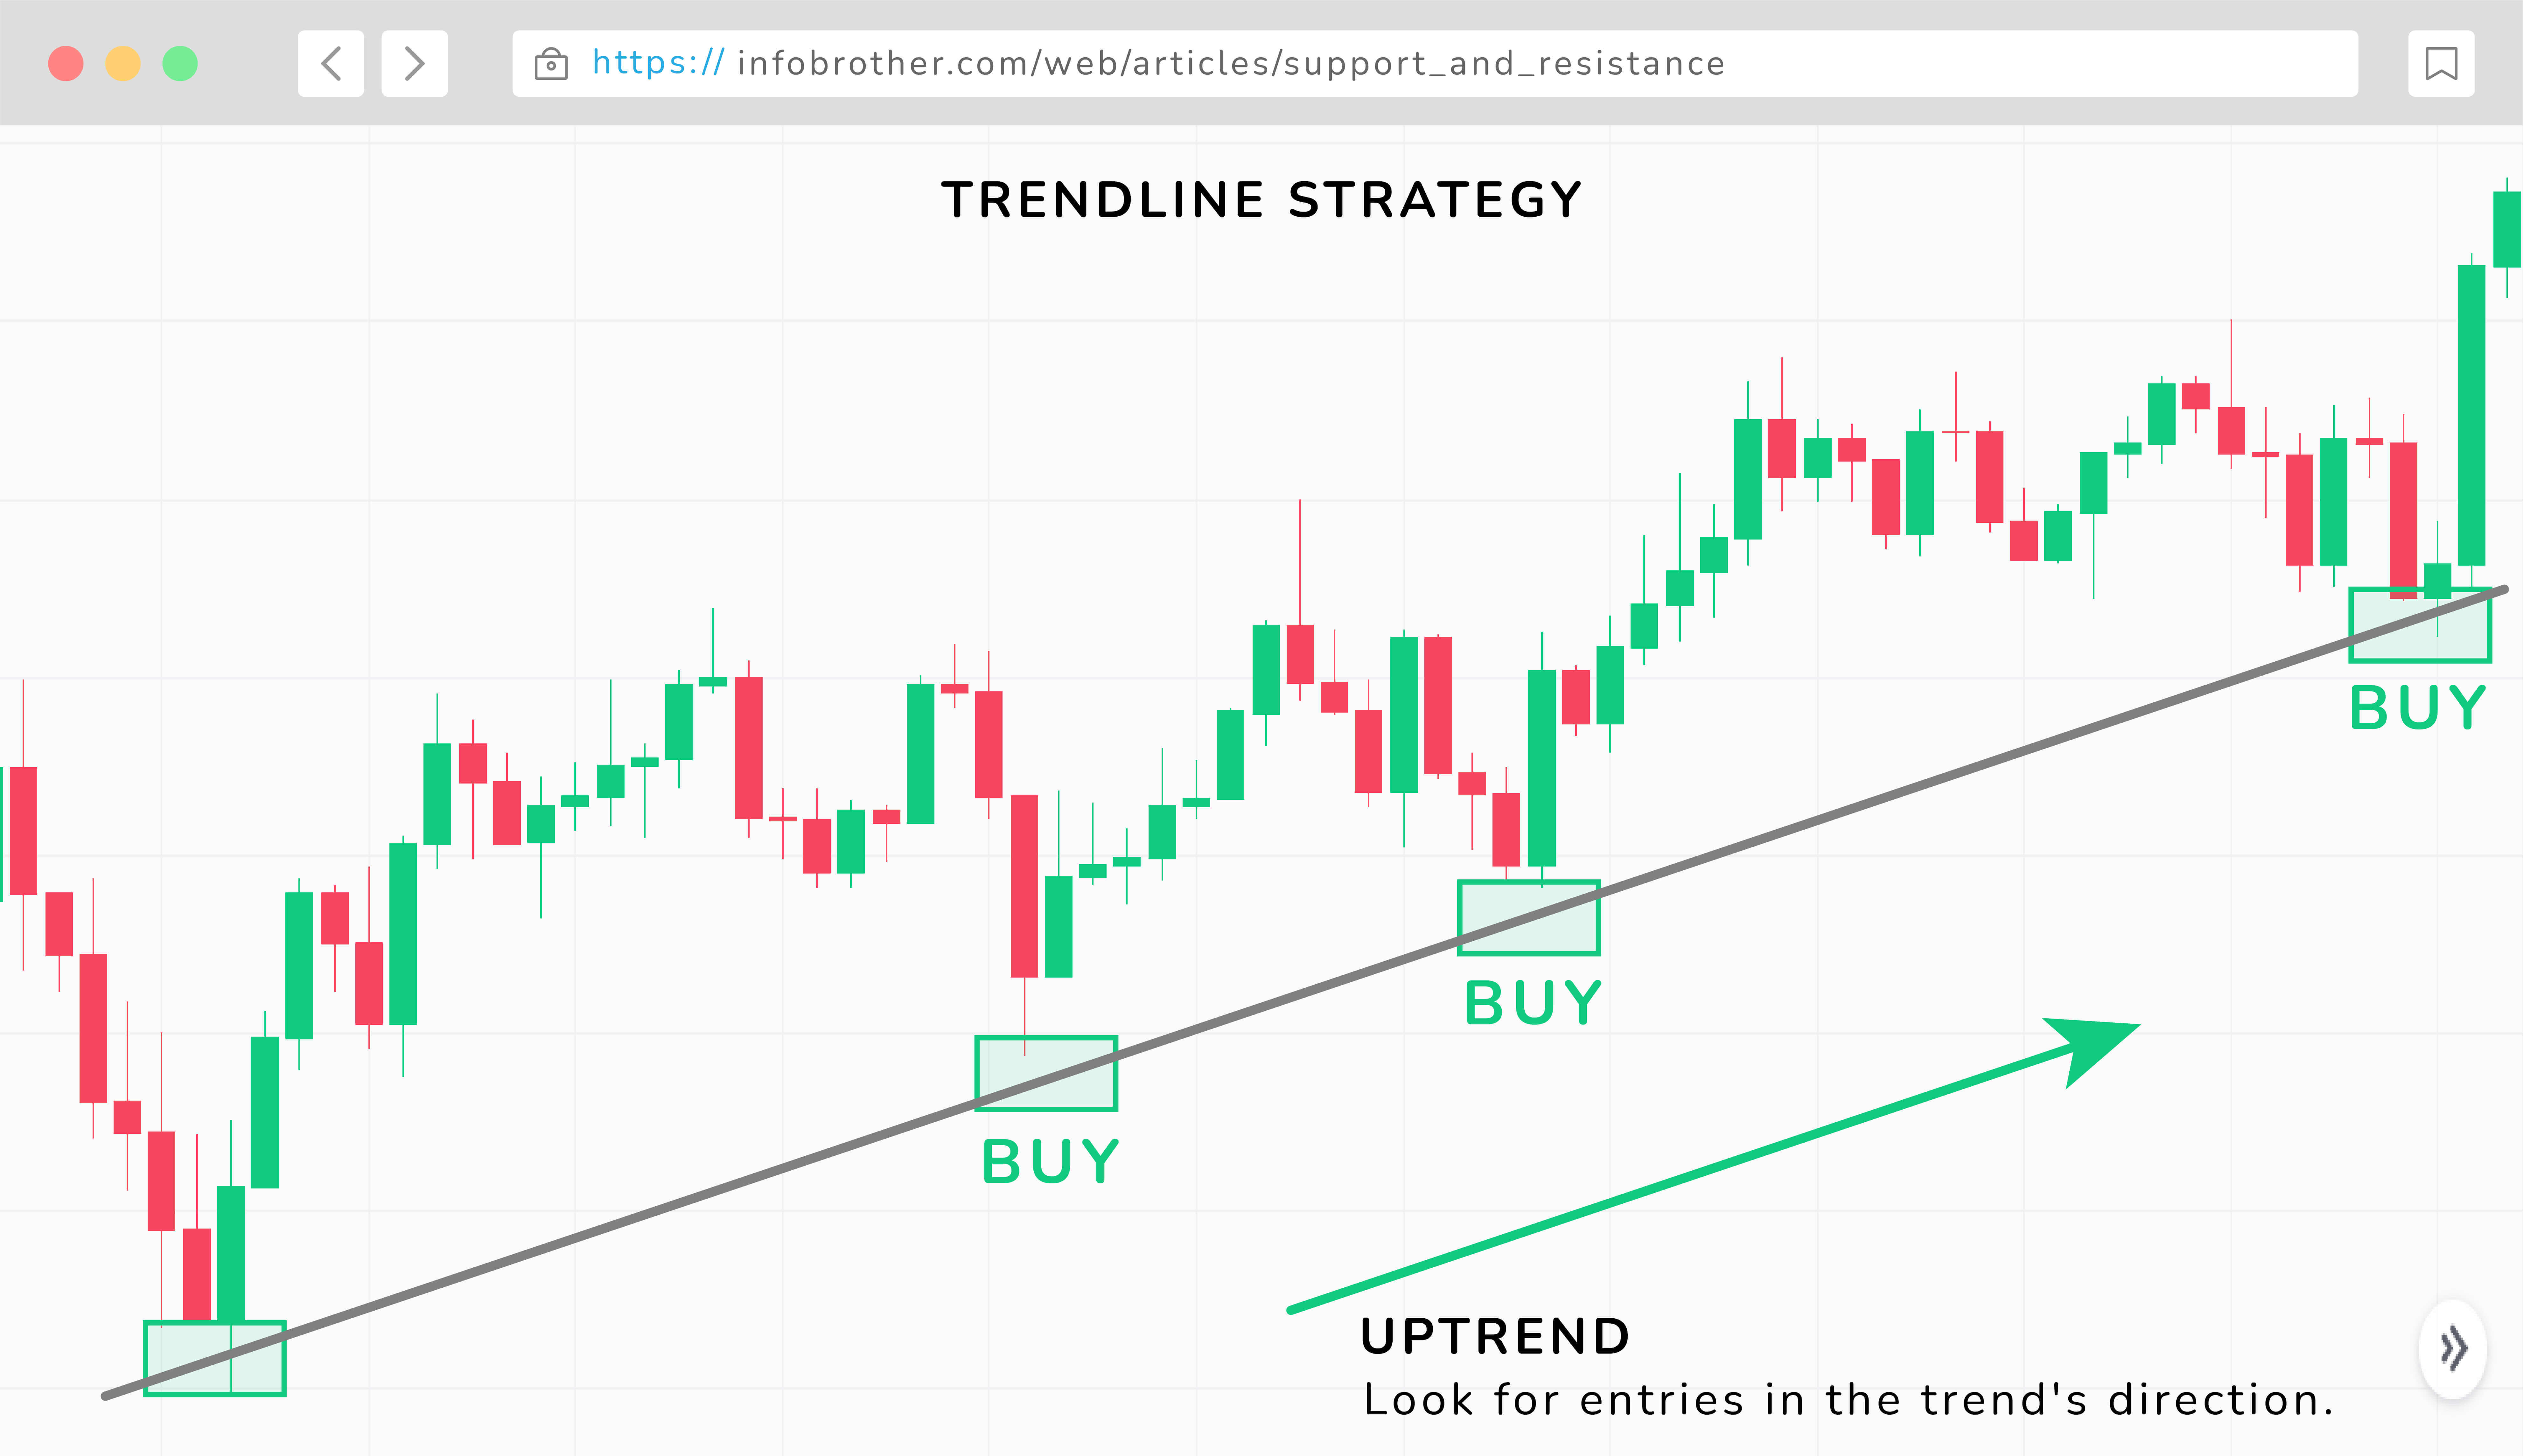
In the trend-line technique, the trendline can be employed as support or resistance. Simply draw a line connecting two or more highs in a downward trend or two or more lows in an upward trend. In a strong trend, prices will bounce off the trendline and continue to move in the trend's direction. As a result, traders should only seek entry in the trend's direction for higher-probability bets.
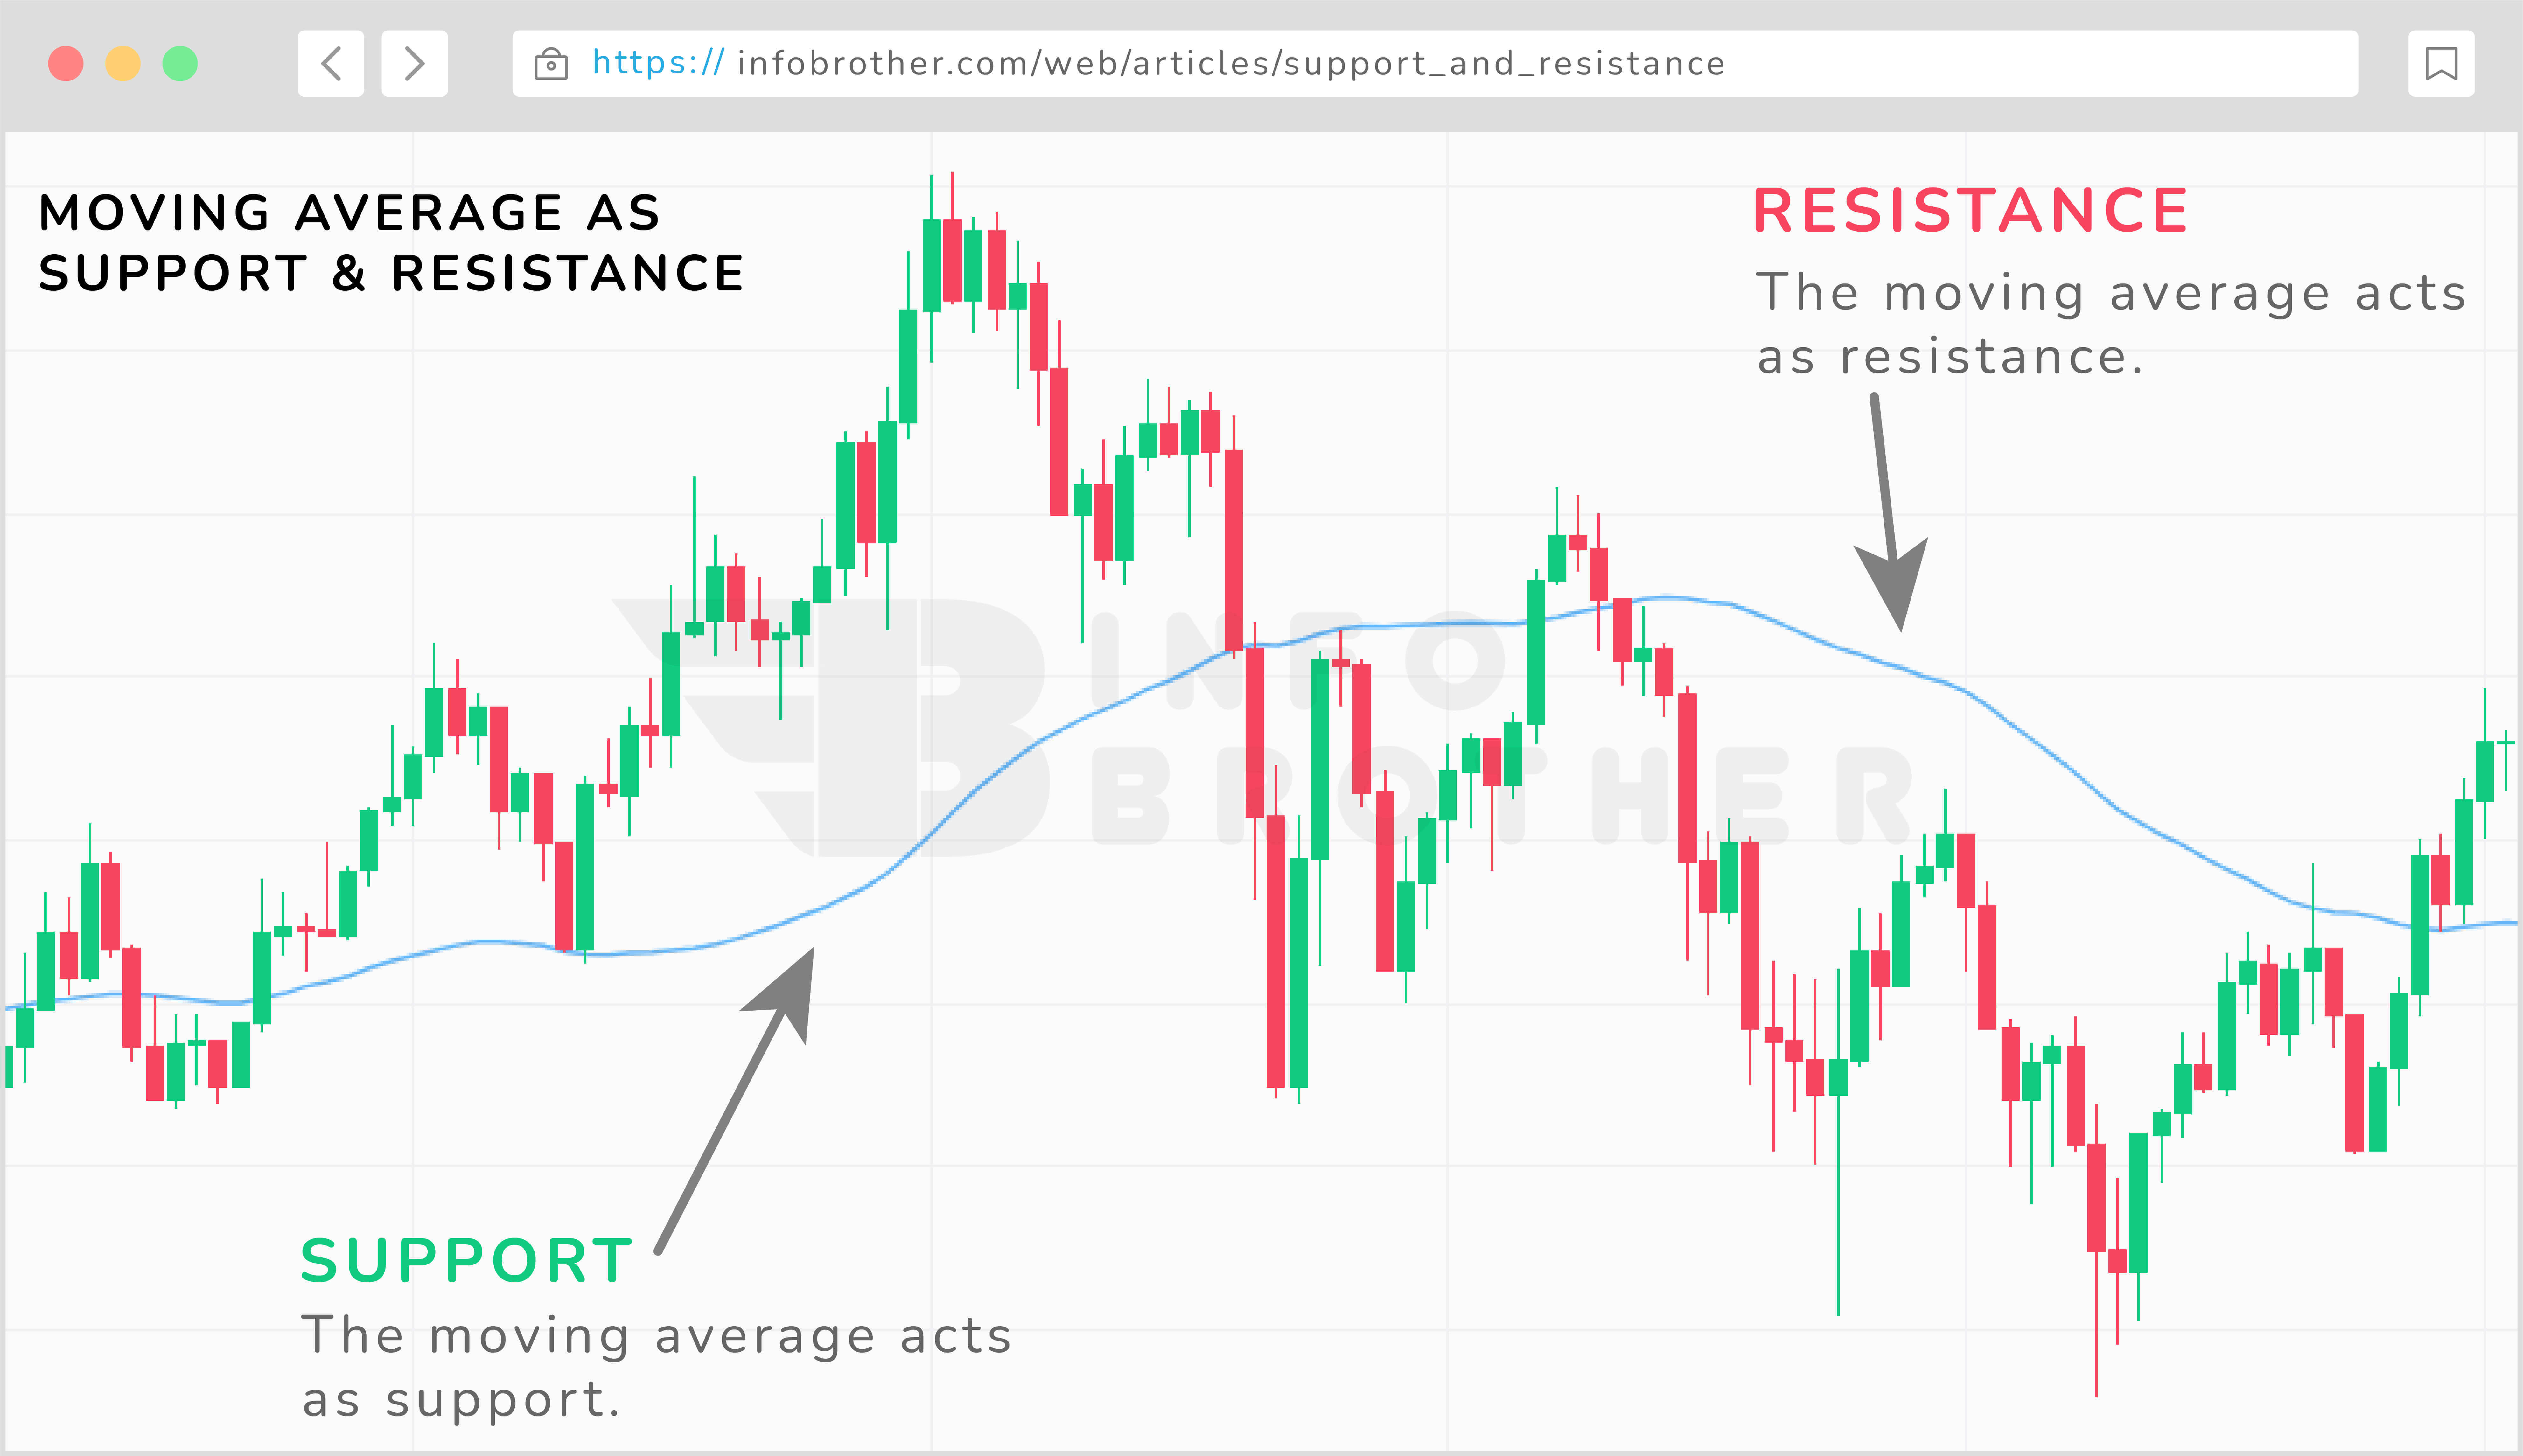
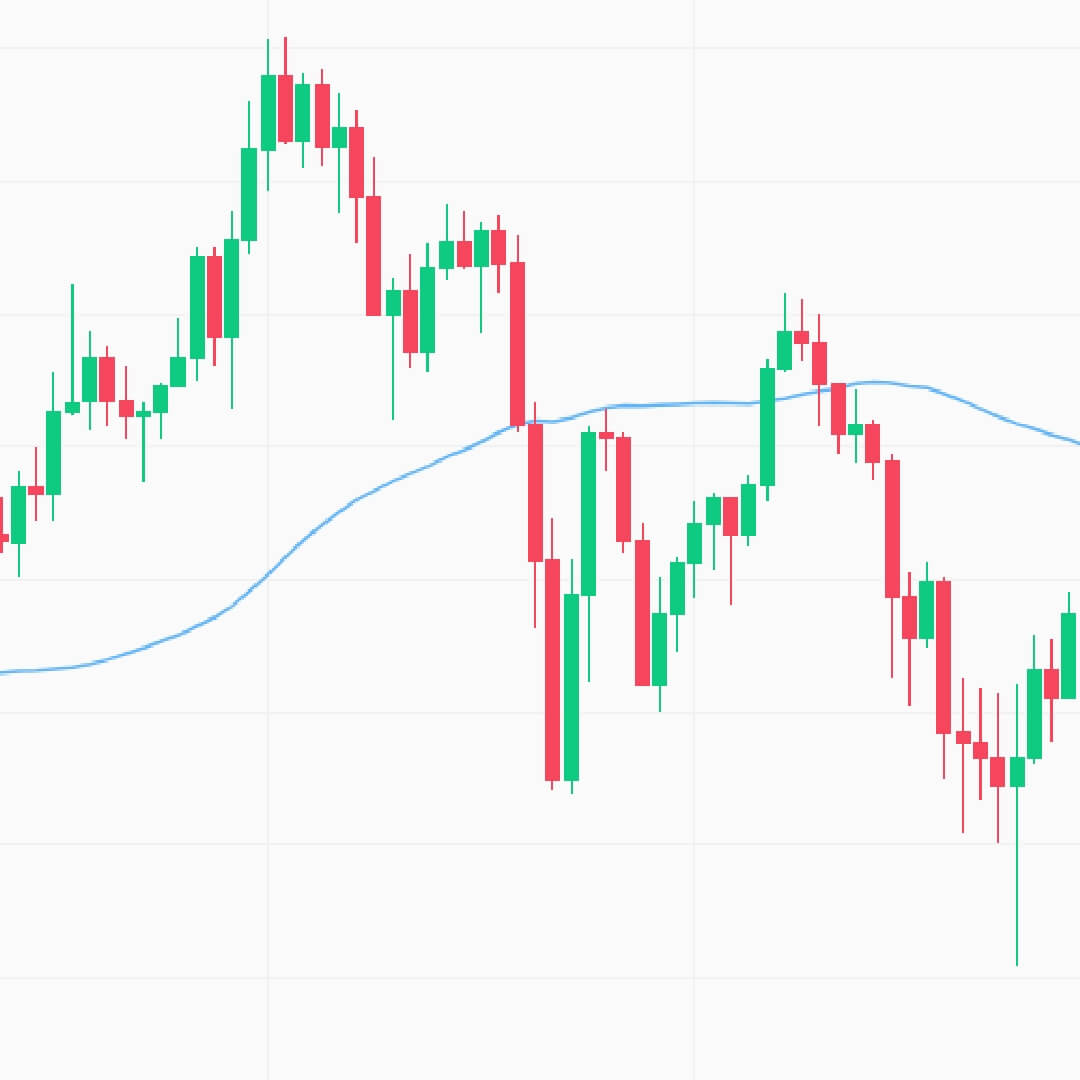
Moving averages may operate as dynamic support and resistance in the market. The 20-period and 50-period moving averages are common moving averages to utilize. Traders commonly employ the 100 and 200 moving averages, and it is ultimately up to the trader to choose a level that they are comfortable with.
As shown in the chart above, the 50 moving average (MA) initially tracks above the market as a line of resistance. The market then declines and reverses, with the 50 MA functioning as dynamic support. Traders may use trendlines to assess which markets are likely to continue trending and which ones are susceptible to a breakout.
One of the most fundamental trading methods is to employ support and resistance levels as a trading strategy. It may be used to limit risk and create stops, as well as to assess market conditions and the ideal entry and exit positions. Buying when the price hits the support level and selling when the price reaches the resistance level is the most prevalent trading method that employs support and resistance levels. Traders should, however, wait for an indicator that the market is still following the trend.

Sardar Omar
I did my hardest to present you with all of the information you need on this subject in a simple and understandable manner. However, if you have any difficulties understanding this concept or have any questions, please do not hesitate to ask. I'll try my best to meet your requirements.
Disclaimer:This material is provided purely for educational purpose and is not intended to provide financial advice.


