Support and Resistance in Trading
Master the fundamentals of support and resistance in trading.
The ideas of trading level support and resistanceare definitely two of the most extensively debated features of technical analysis.Part of studying chart patterns, these phrases are used by traders to refer to price levels on charts that tend to behave as barriers, stopping the price of an asset from becoming pushed in a given direction.
Among all the aspects of technical analysis, perhaps the most important and actionable concepts are support and resistance. Many other aspects of technical analysis, such as price patterns, are based on the key concepts of support and resistance. In this post, we will define support and resistance and show you how to create ideal trendlines for a profitable trade.

Understanding the support and resistance levels on a candlestick chartcan help you decide whether to buy or sell at a certain price. The price at which there will be more demand than supply is known as the support price. The support level is the price on the chart at which traders expect the highest demand for a stock to occur in terms of purchases.
The resistance level on a candlestick chart is the price at which more sellers than buyers are expected. It prevents the price from rising any higher, and a resistance level is a price point on the chart at which traders expect the most selling supply for a certain stock.
Support and resistance is a technical analysis concept that states that when a stock's price reaches a specific, pre-determined price level, it usually pauses and moves in the opposite direction.
Support Level:
This is the point at which a stock's price can no longer decline. The price is expected to retrace its steps and rise in the other direction. At this point, buyers are projected to outnumber sellers by a large margin.
The idea behind the support level is that when the price approaches support and therefore becomes cheaper, consumers sense a better bargain and are more inclined to purchase. Because they are receiving a bad bargain, sellers become less reluctant to sell. Buyers (demand) will outnumber sellers (supply) in this situation, preventing the price from going below support.
Resistance Level:
The inverse of a support level is a resistance level. It is a price level over which the stock price is not projected to climb further. This is the price at which there are more sellers than buyers in the market for a specific stock.
The theory behind the resistance level is that when the price approaches resistance and becomes more costly, sellers are more inclined to sell and buyers are less likely to purchase. In such a case, sellers (supply) will outnumber purchasers (demand), preventing the price from rising above resistance.
Once a support or resistance area has been recognized, those price levels can be used as potential entry or exit points because when a price gets to a point of support or resistance, it will either bounce back away from it or violate it and keep going in the same direction until it reaches the next support or resistance level.
Some transactions are timed based on the assumption that support and resistance levels will not be violated. Traders may "bet" on the direction and immediately ascertain whether they are accurate, whether the price is stopped by the support or resistance level or breaks through. The trade may be terminated at a small loss if the price swings in the opposite direction. However, if the price swings in the proper direction, the change might be significant.
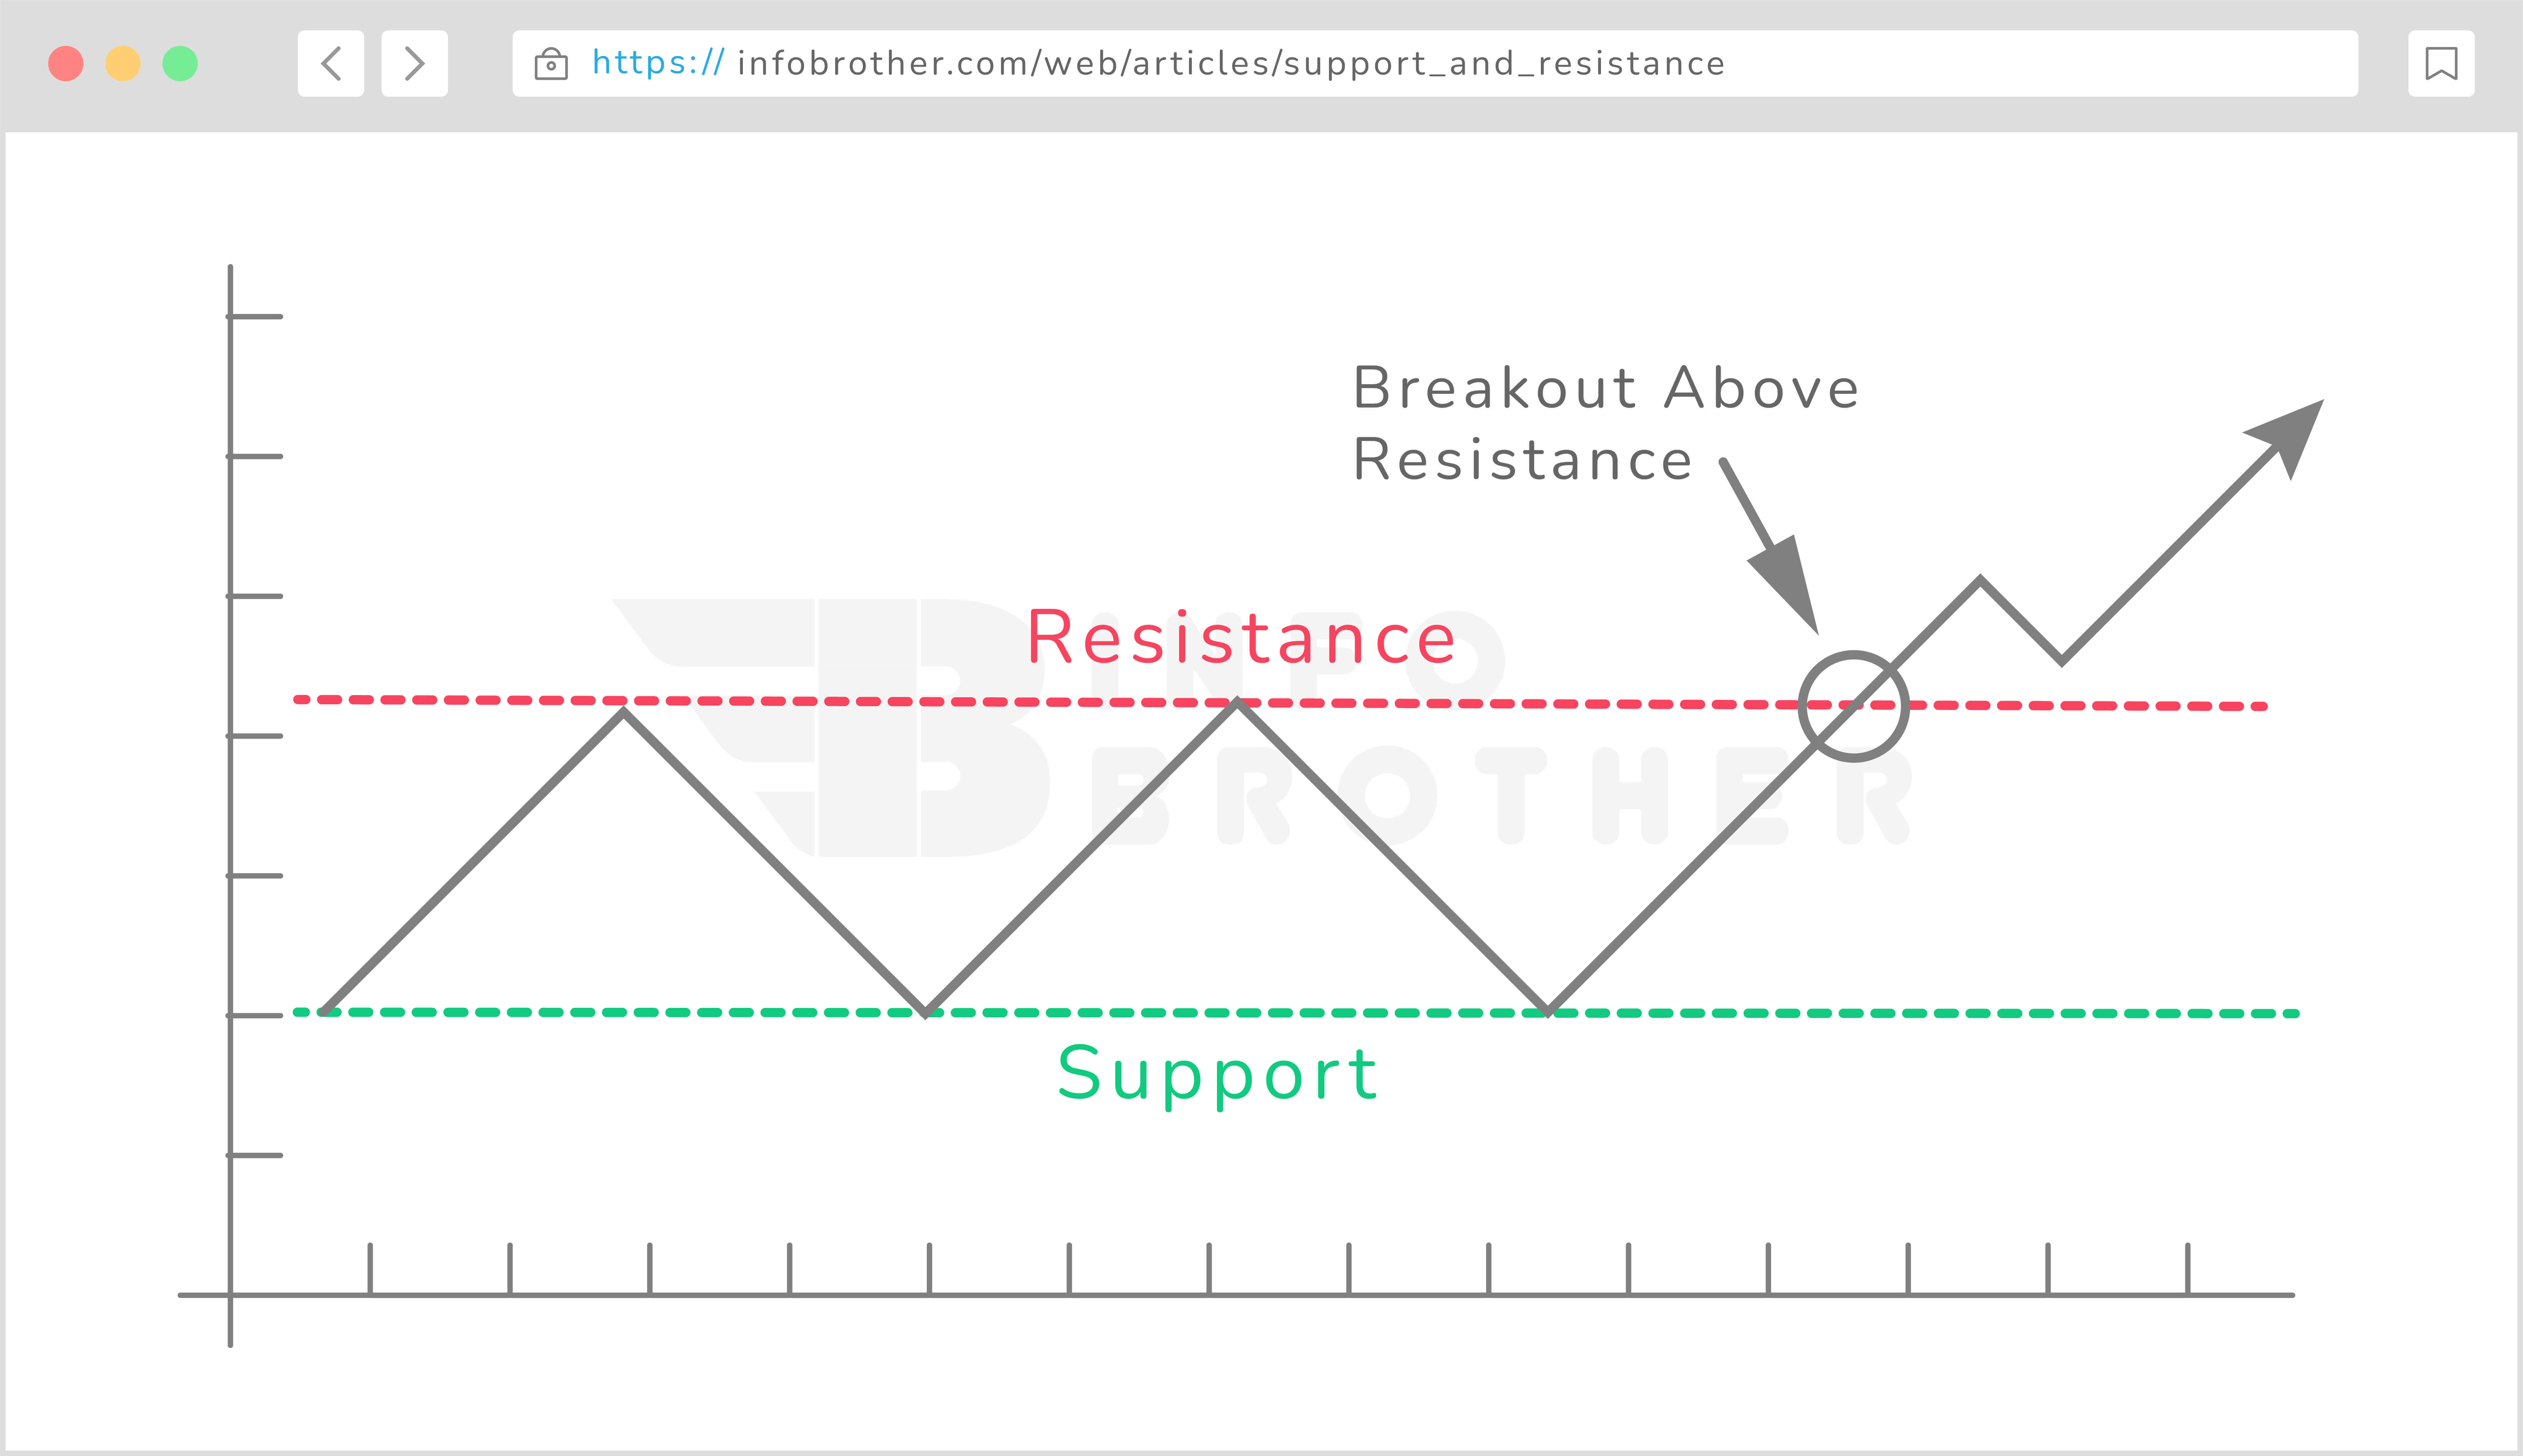
The support and resistance levels provide a trader with a sense of how a stock's price will move. It is conceivable, though, that the stock price will break through these levels. When this occurs (as it often does), a new level of support and resistance is established.
If the support level is broken, the stock's price will continue to decrease until it finds a new support level. If the resistance level is broken, the stock price will continue to increase until it hits a new level of resistance.
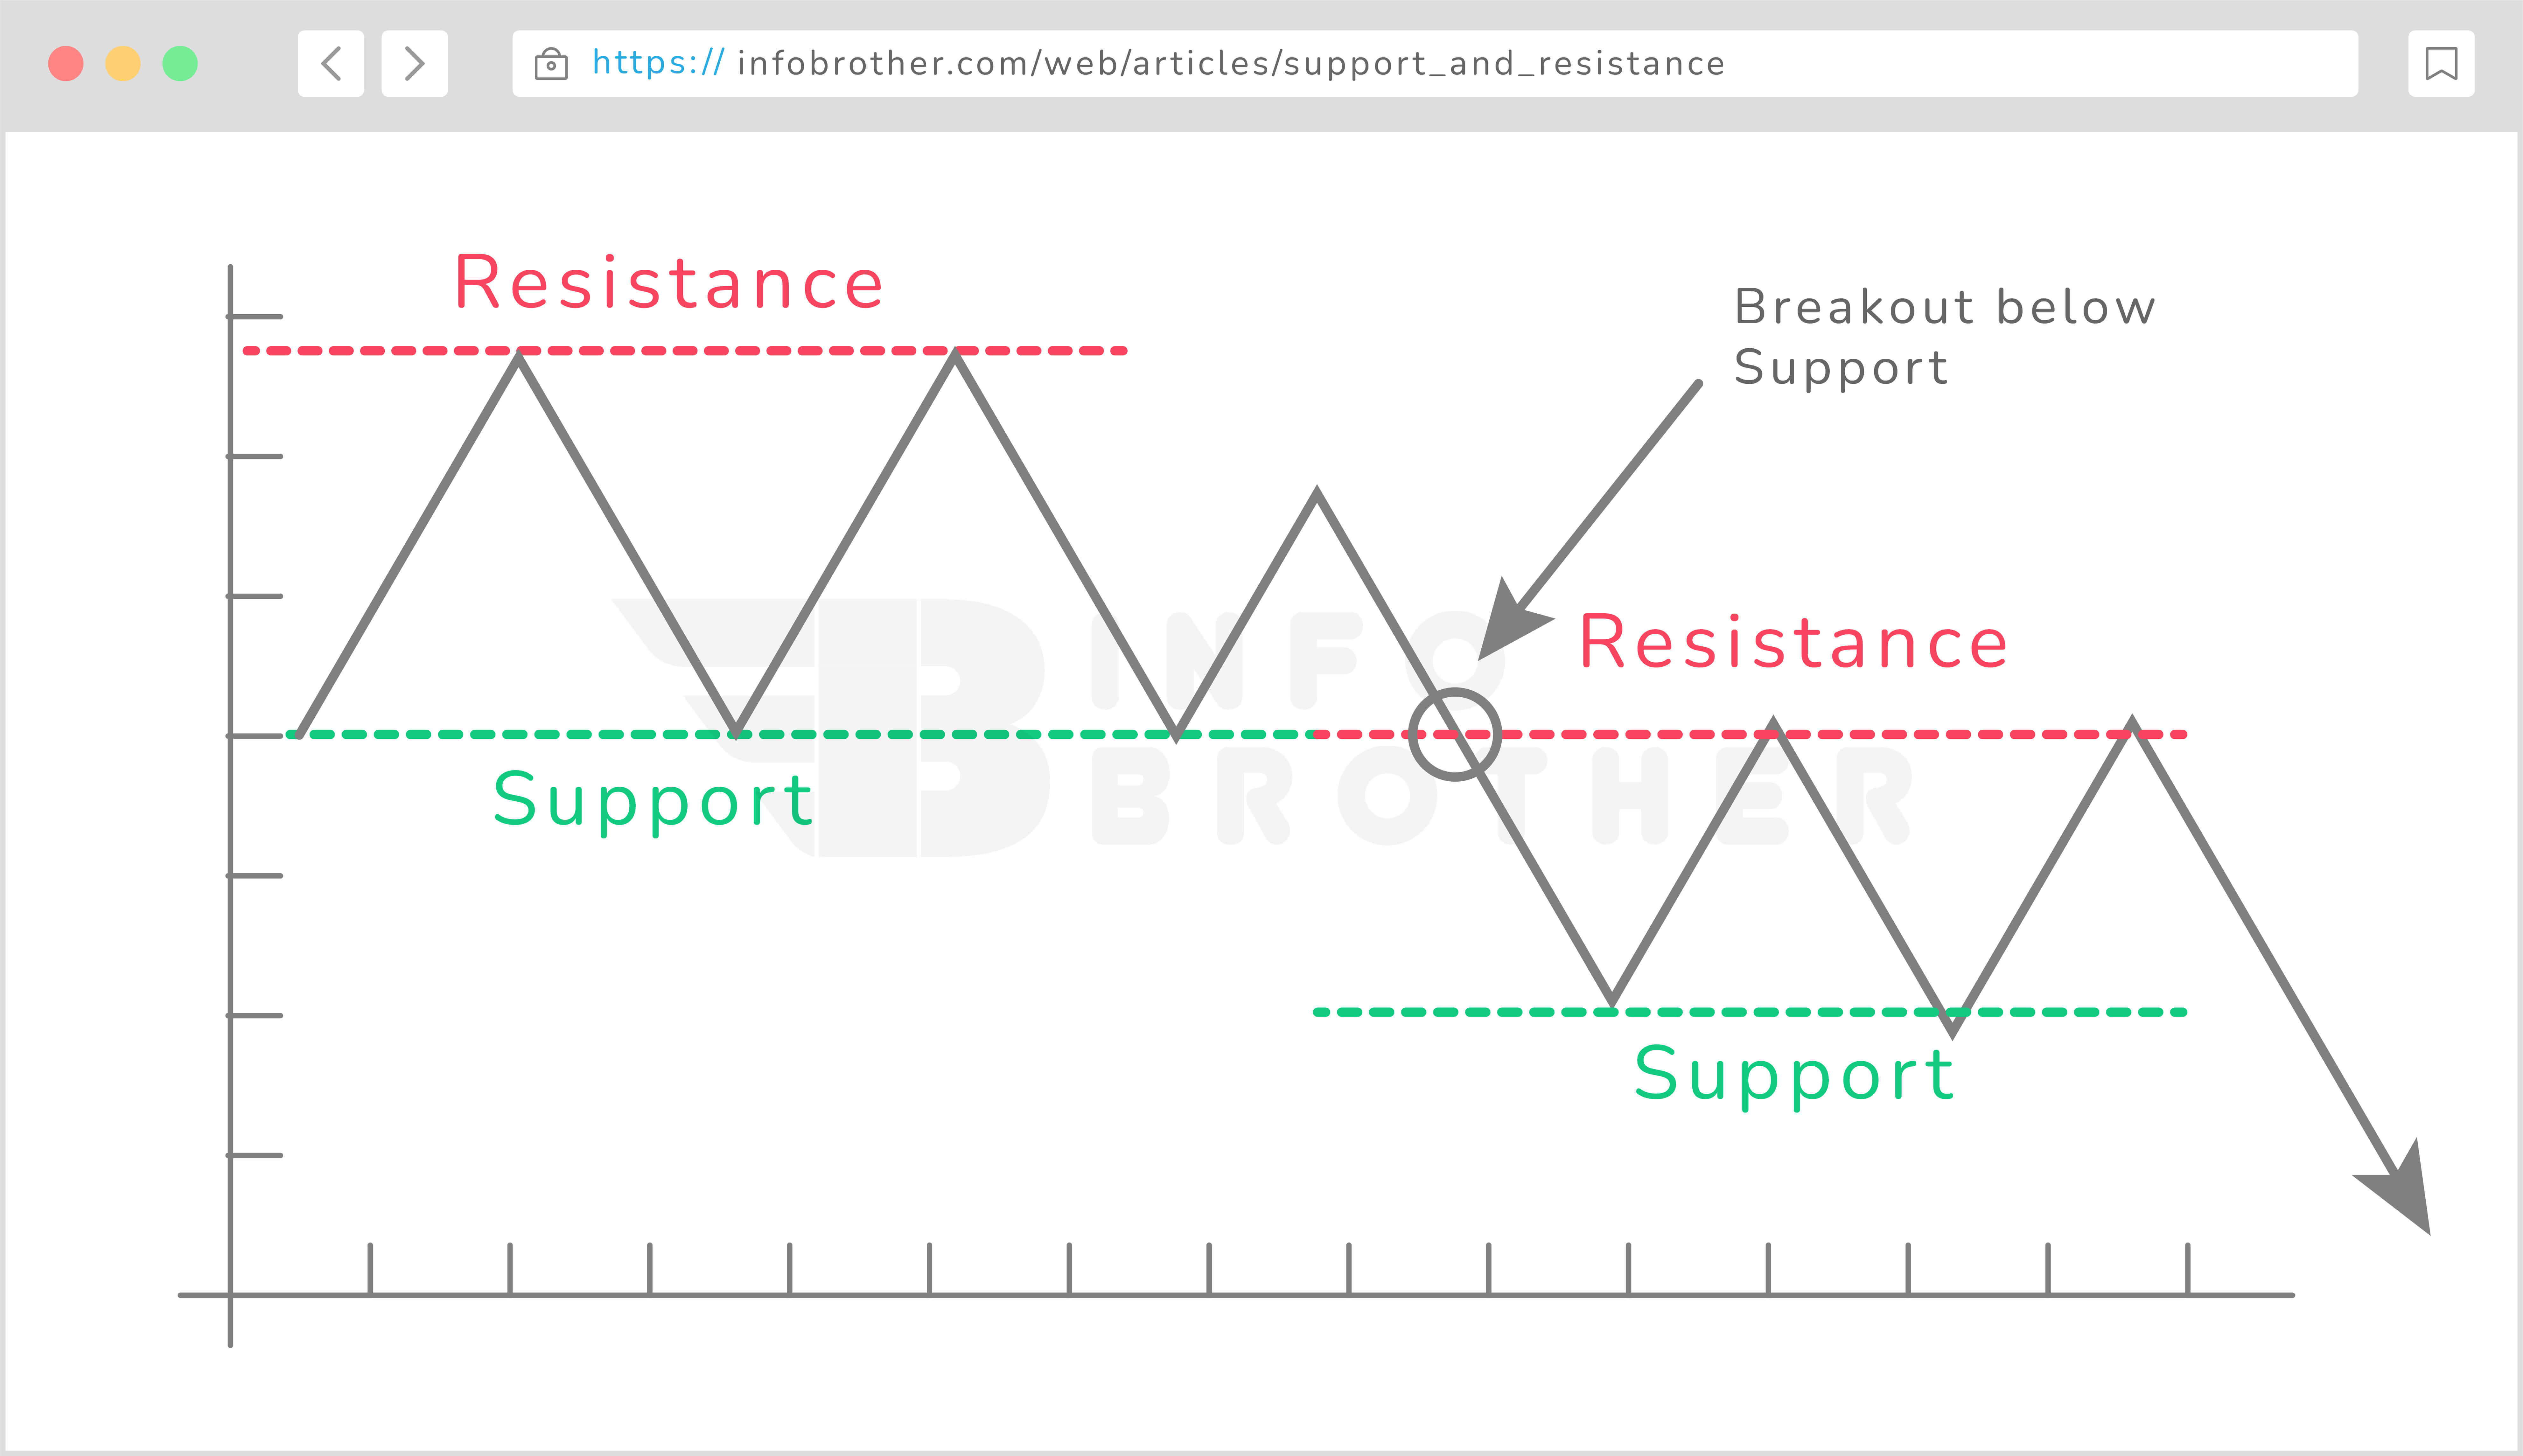
Previous Support Become Resistance:
The functions of support and resistance are interchangeable. As a result, if support fails, resistance may emerge. When resistance crumbles, support may emerge, as shown in the illustration below.
4 Proven Strategies for Trading Support and Resistance Levels
Support and resistance is a technical analysis concept that states that when a stock's price reaches a specific, pre-determined price level, it usually...
Read More
The trend is a fundamental concept in technical analysis that typically displays market direction,the way it is moving—upward and downward, or sideways.
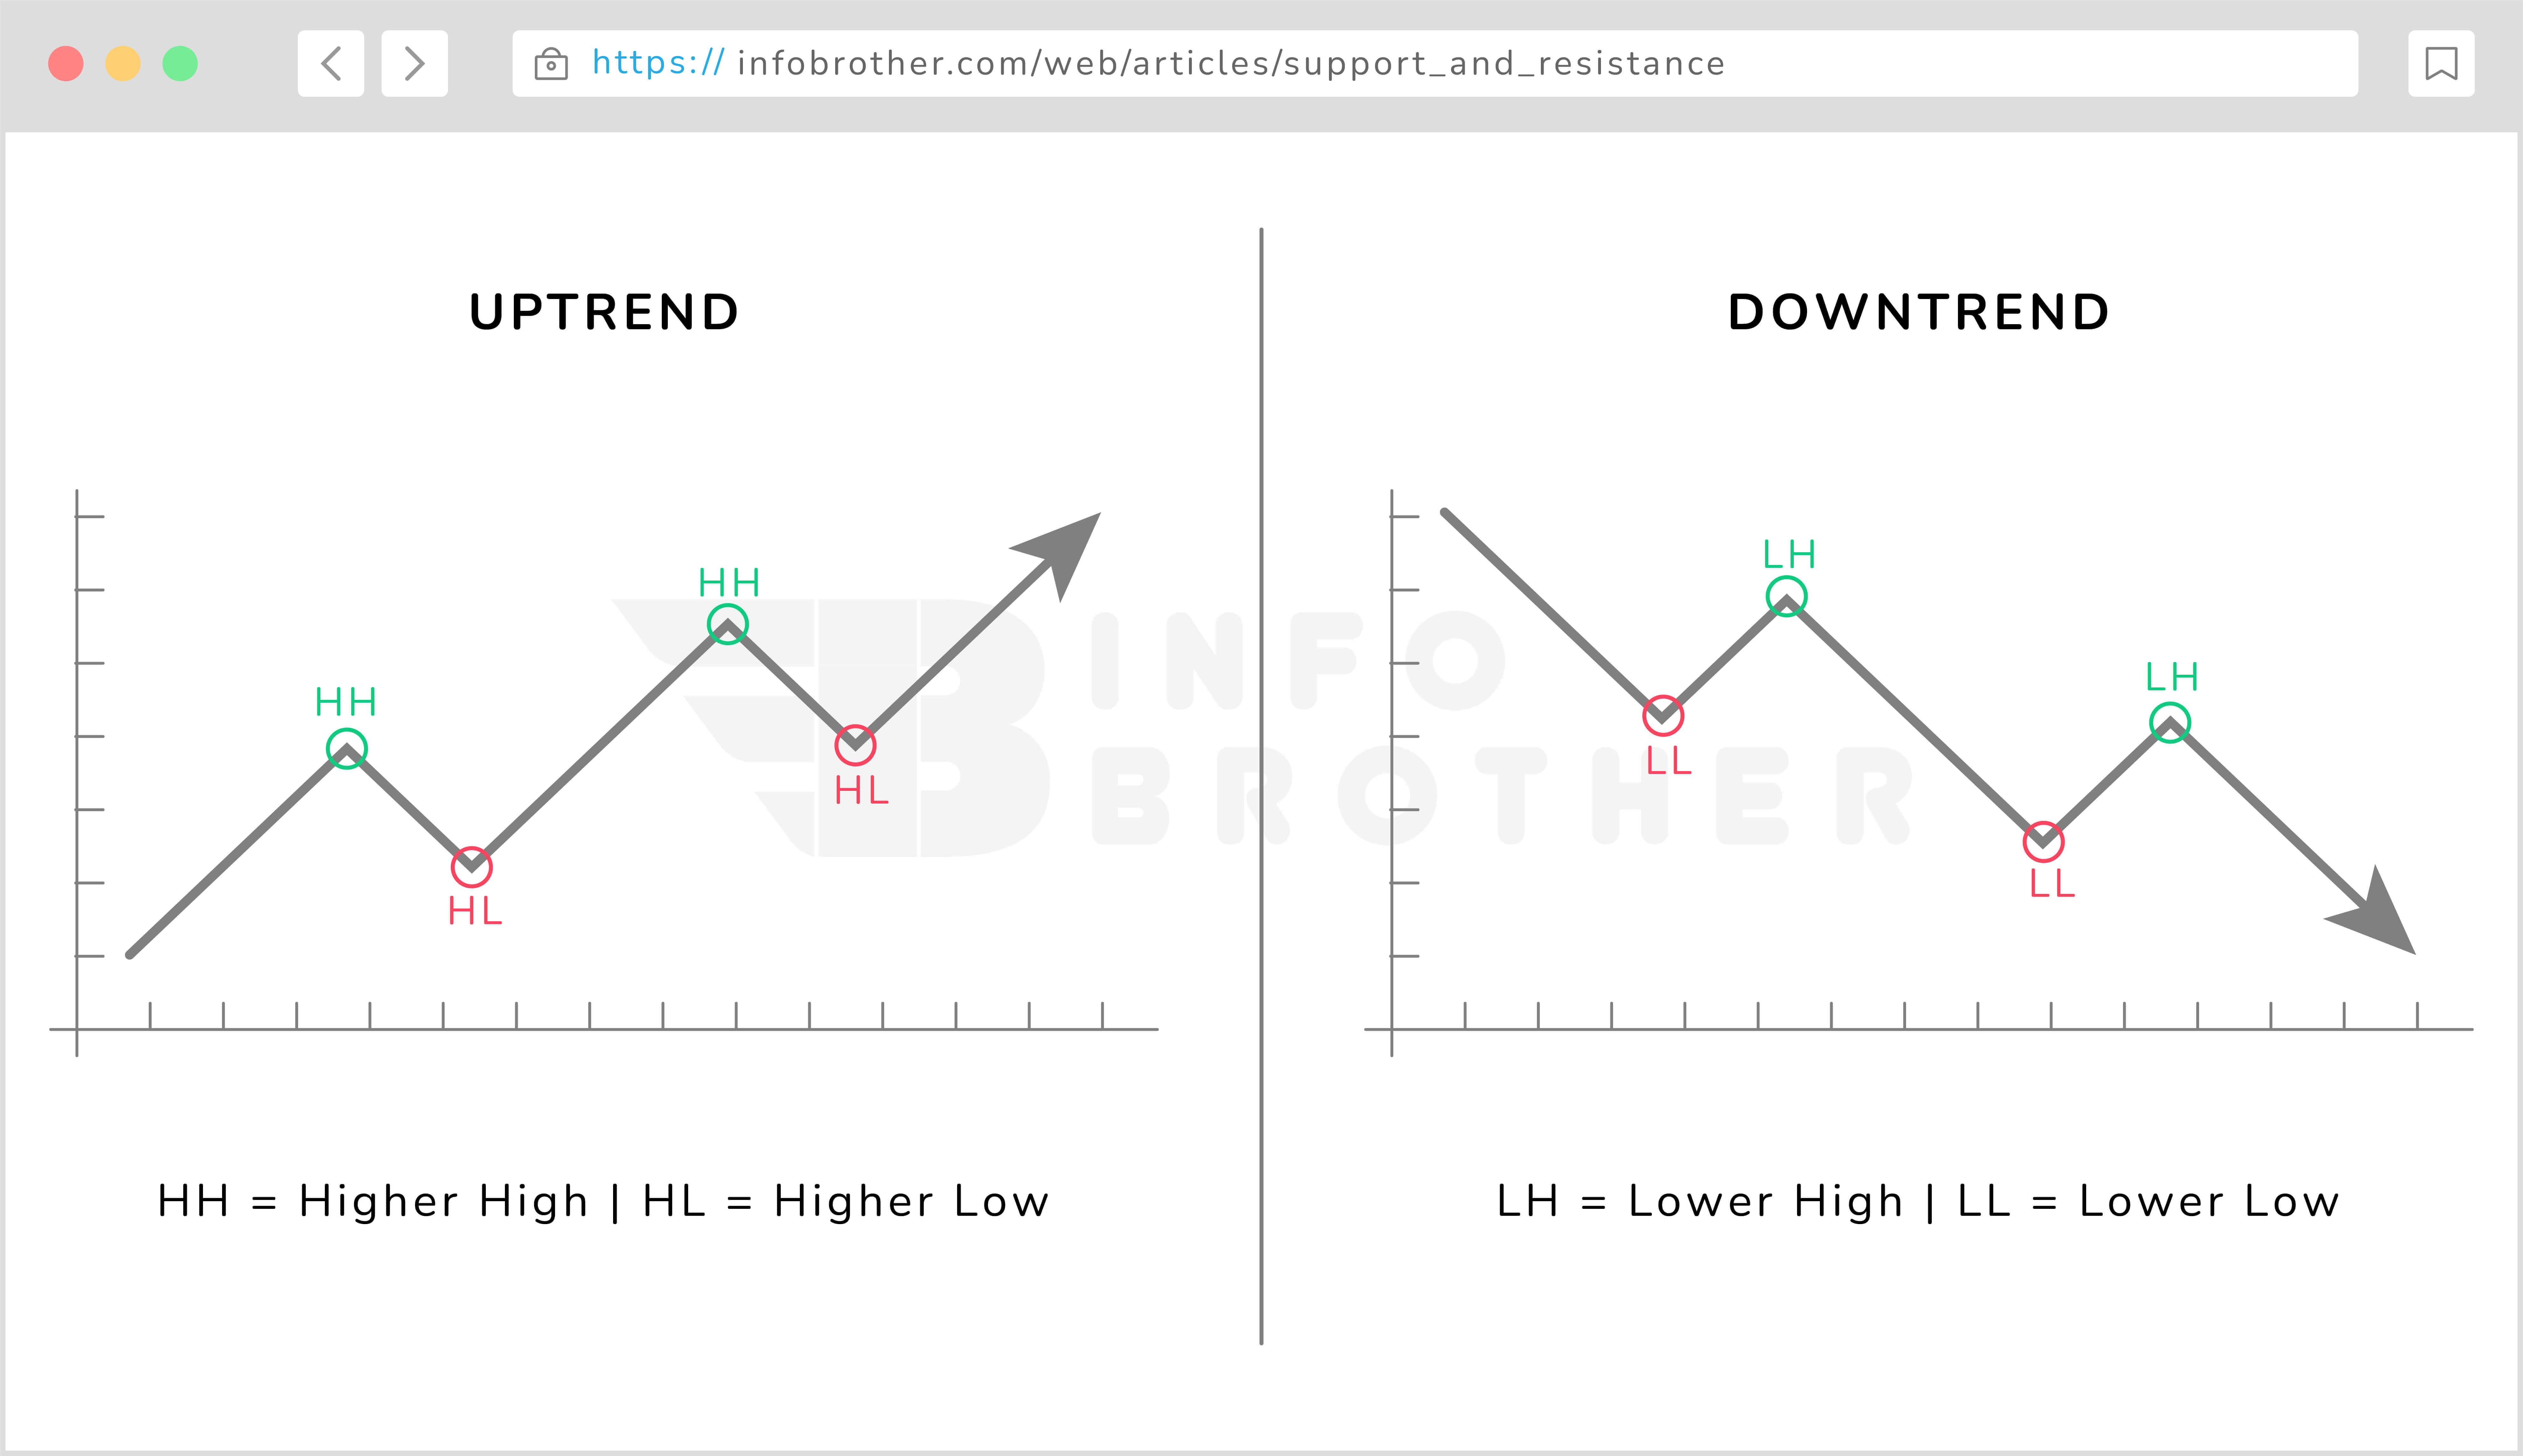
The trend has three directions - uptrend, downturn, and sideways. When the market is on an upswing, a purchase approach is recommended. When the market is in a decline, a sell approach is recommended. When the market is sideways, it is best to remain away from the market. The issue is, how to detect an uptrend, a downtrend, or sideways movement?
- If the price is going up and establishing new higher high peaks, it suggests the market is in an uptrend.
- If the price is heading down and establishing new lower high levels, it suggests the market is in a downtrend.
- If the price is not producing substantial higher high or lower high levels and moving within a range (high level and low level), the market is sideways.
Trend lines, as the name indicates, are technical analysis levels that may be drawn along a trend to signify either support or resistance, based on the trend's direction. Consider them to be the diagonal counterparts of horizontal support and resistance. These trend lines may assist us in identifying regions of higher supply and demand, which can lead the market to go down or up.
Consider the following example of a trend line constructed during an upswing.
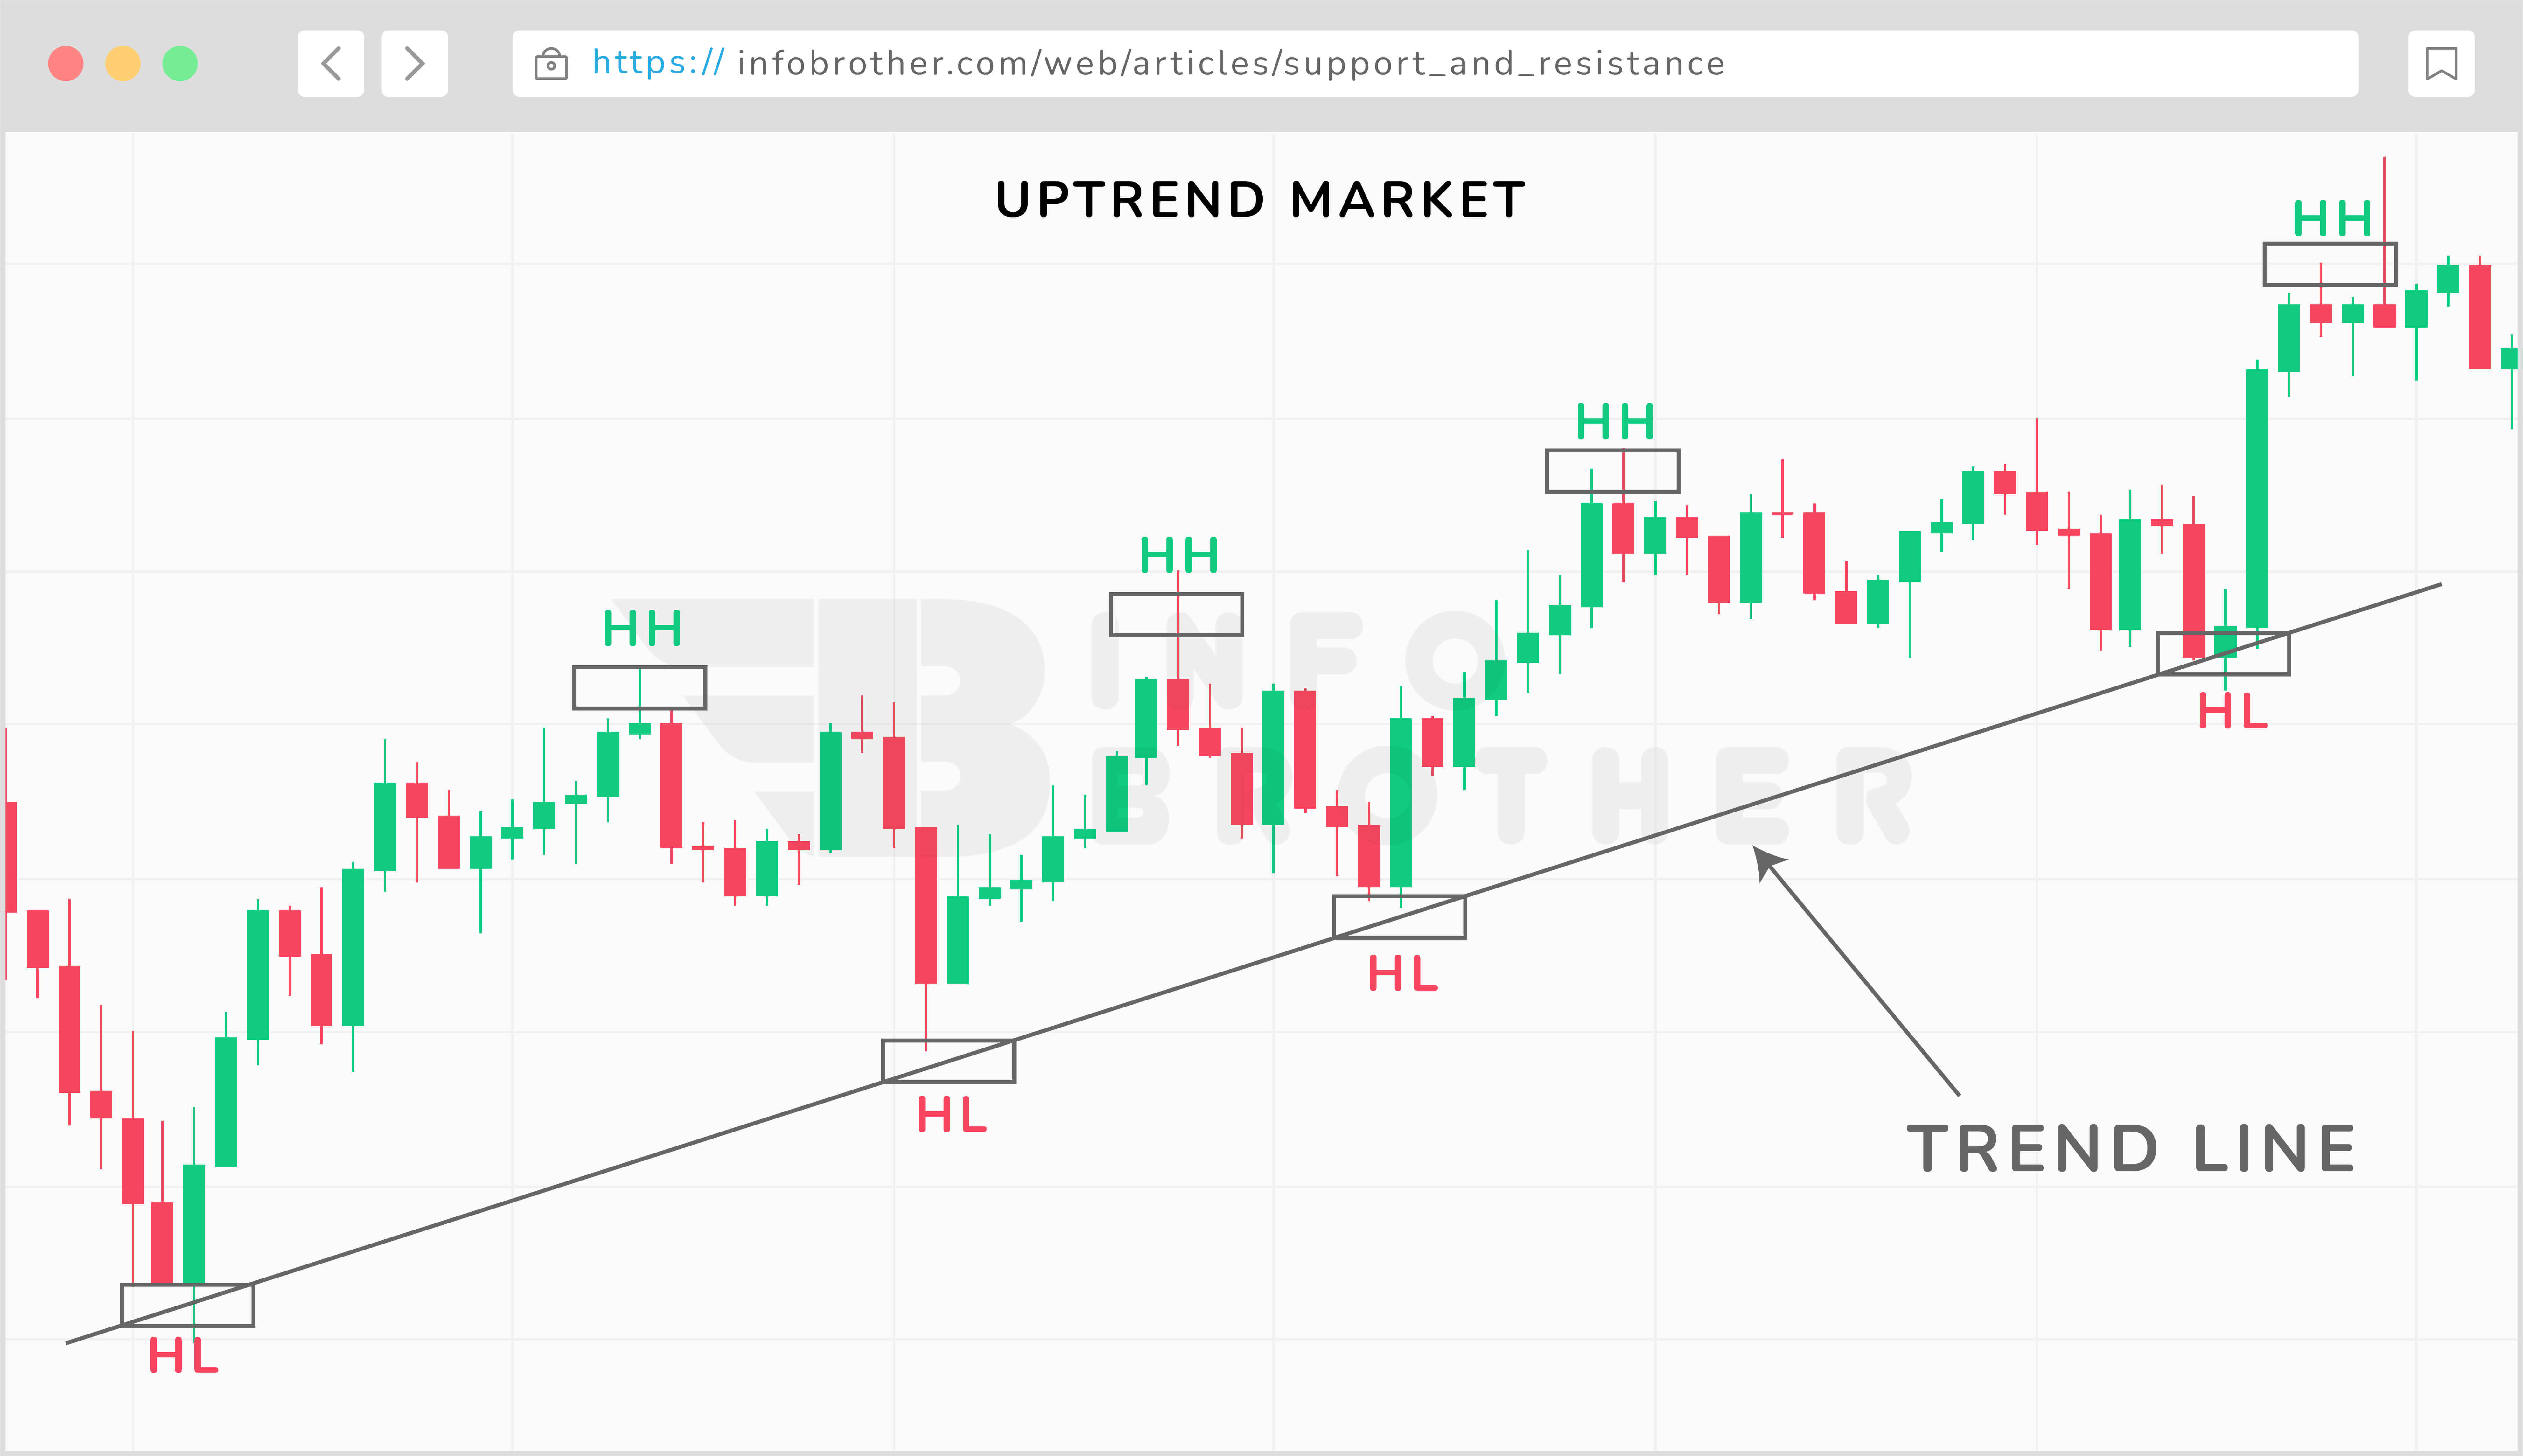
Notice how the market struck the trend line support multiple times over a long period of time in the above candlestick chart? This trend line marks a level of support from which traders might start looking for purchasing opportunities. You can also see that the market respects the trend line, and that when price approaches it, it reverses and continues in the same direction. When the market swings in this manner, trend lines assist us in anticipating the next impulsive move in the market's direction.
Let's look at how to create trend lines now that we've got a decent concept of what they are. The first rule of trend line drawing is that you must start a trend line with at least two points in the market. You may create your trend line when you've found the second swing low or high.
Here's an example of one of the first two swing lows found.
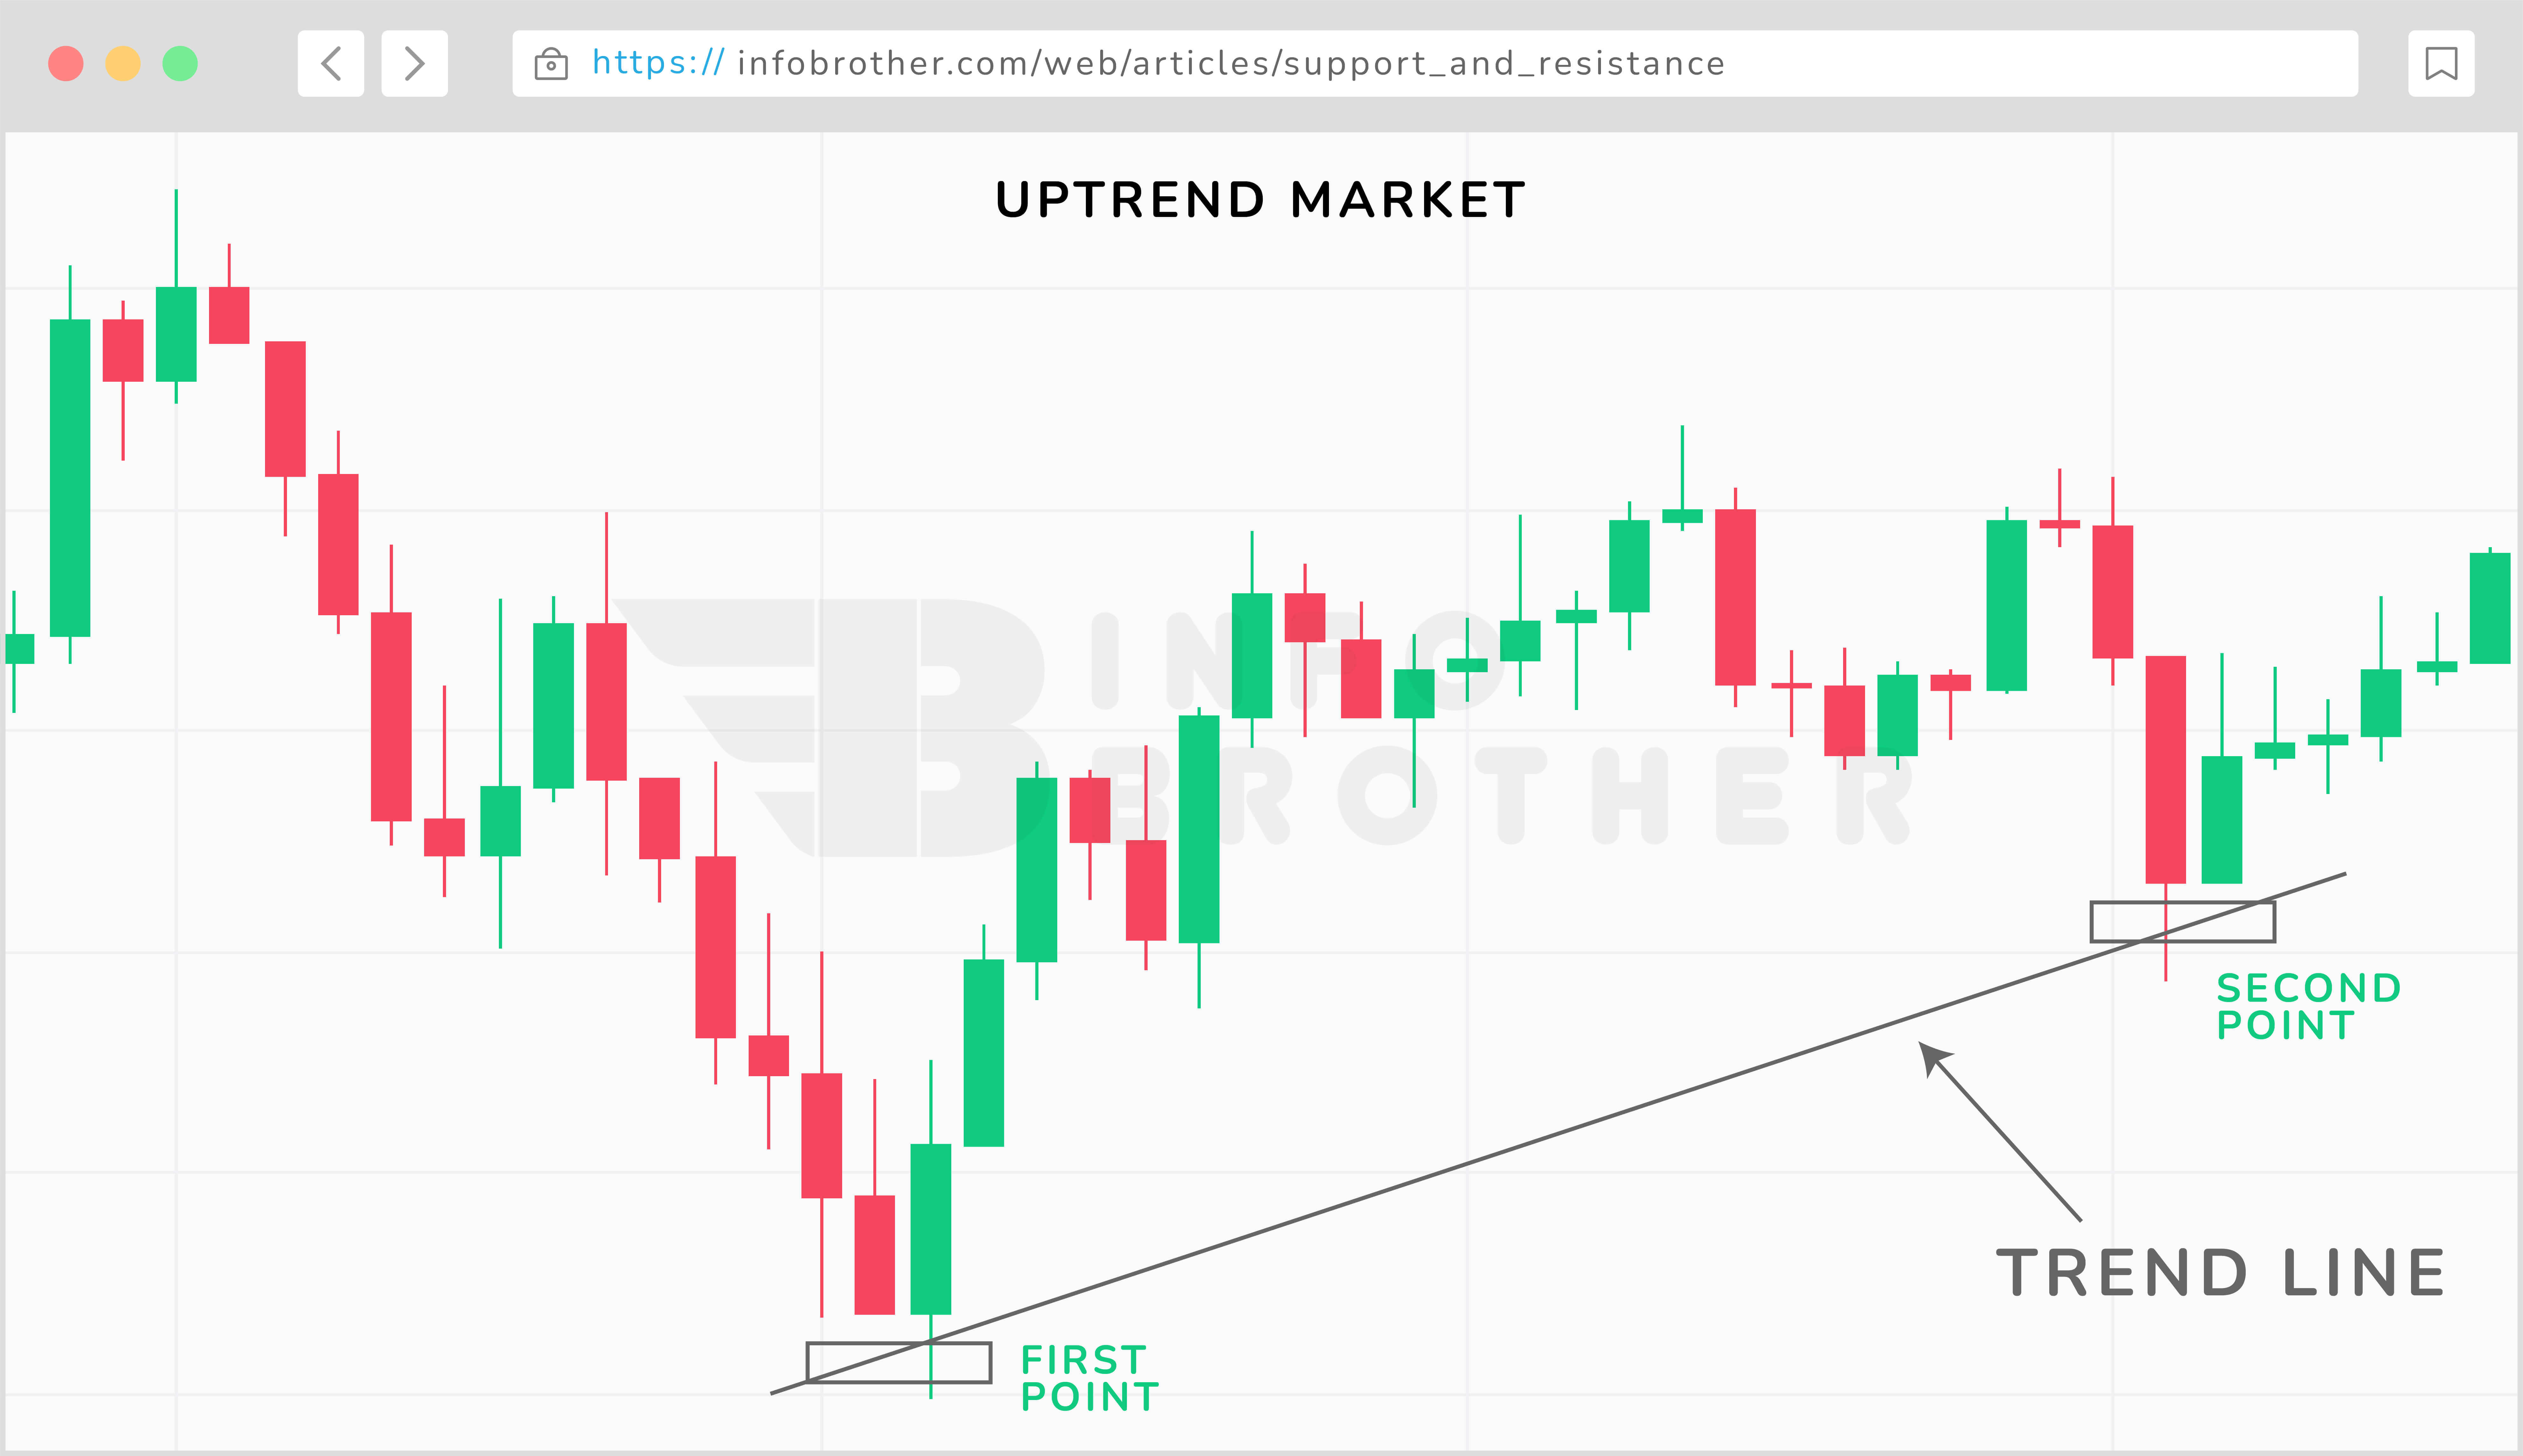
In the chart above, we can see that there are two primary points where we may begin to create our trend line. Once this level has been established, we may begin looking for the rally's next primary point. The following primary point served as a warning to traders that the trend line would most likely hold. Traders were able to join the rise by buying near support.

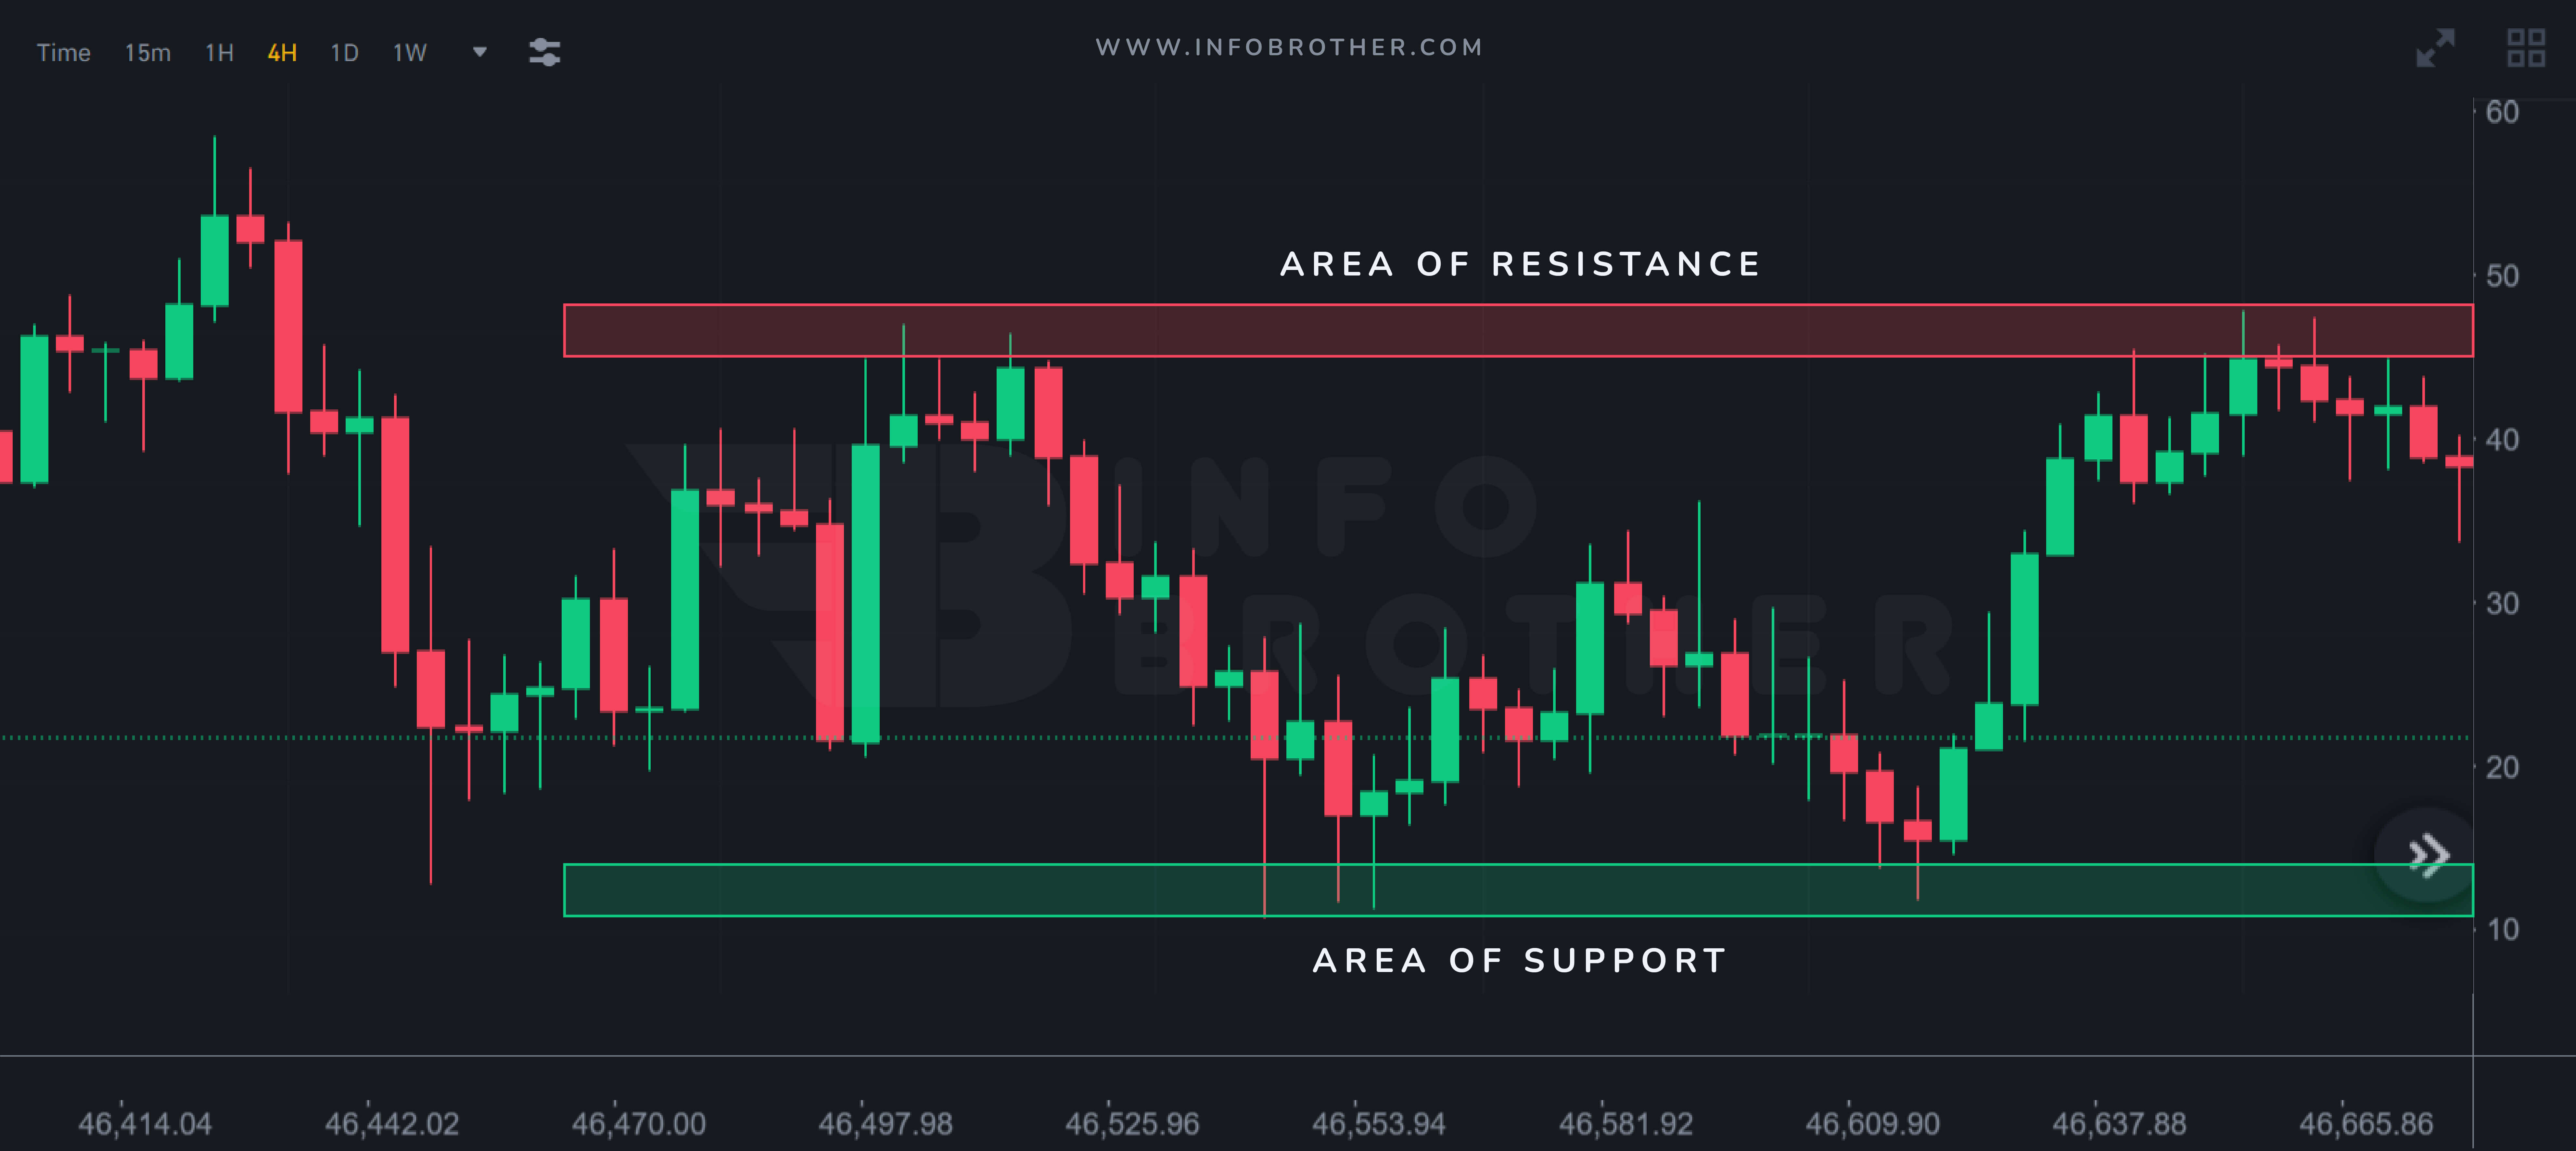
Range trading occurs in the zone between support and resistance, with traders attempting to purchase at support and sell at resistance. Consider the space between support and resistance to be a room. The ground is support, while the roof is resistance. Ranges are common in sideways trading environments with no obvious sign of a trend.
Here are some key considerations to bear in mind when investing in the range market.
- Support and resistance levels are not always perfectly straight lines. Price may sometimes bounce off a specific region rather than a completely straight line.
- Traders must define a trading range and, as a result, locations of support and resistance. The region of support and resistance may be recognized and is shown in the above figure.
- Traders seek long entries when the price rebounds off support and short entries when the price rebounds off resistance when the market is range-bound.
- Price has not always maintained the boundaries of support and resistance, so traders should consider placing their stop-loss below the support when long and above the resistance when short.
When price breaks out of a given range, it is either a true breakout or a false breakout, which is commonly referred to as a "fakeout."When markets break out of their trading range, it's critical to use solid risk management to reduce the negative risk.
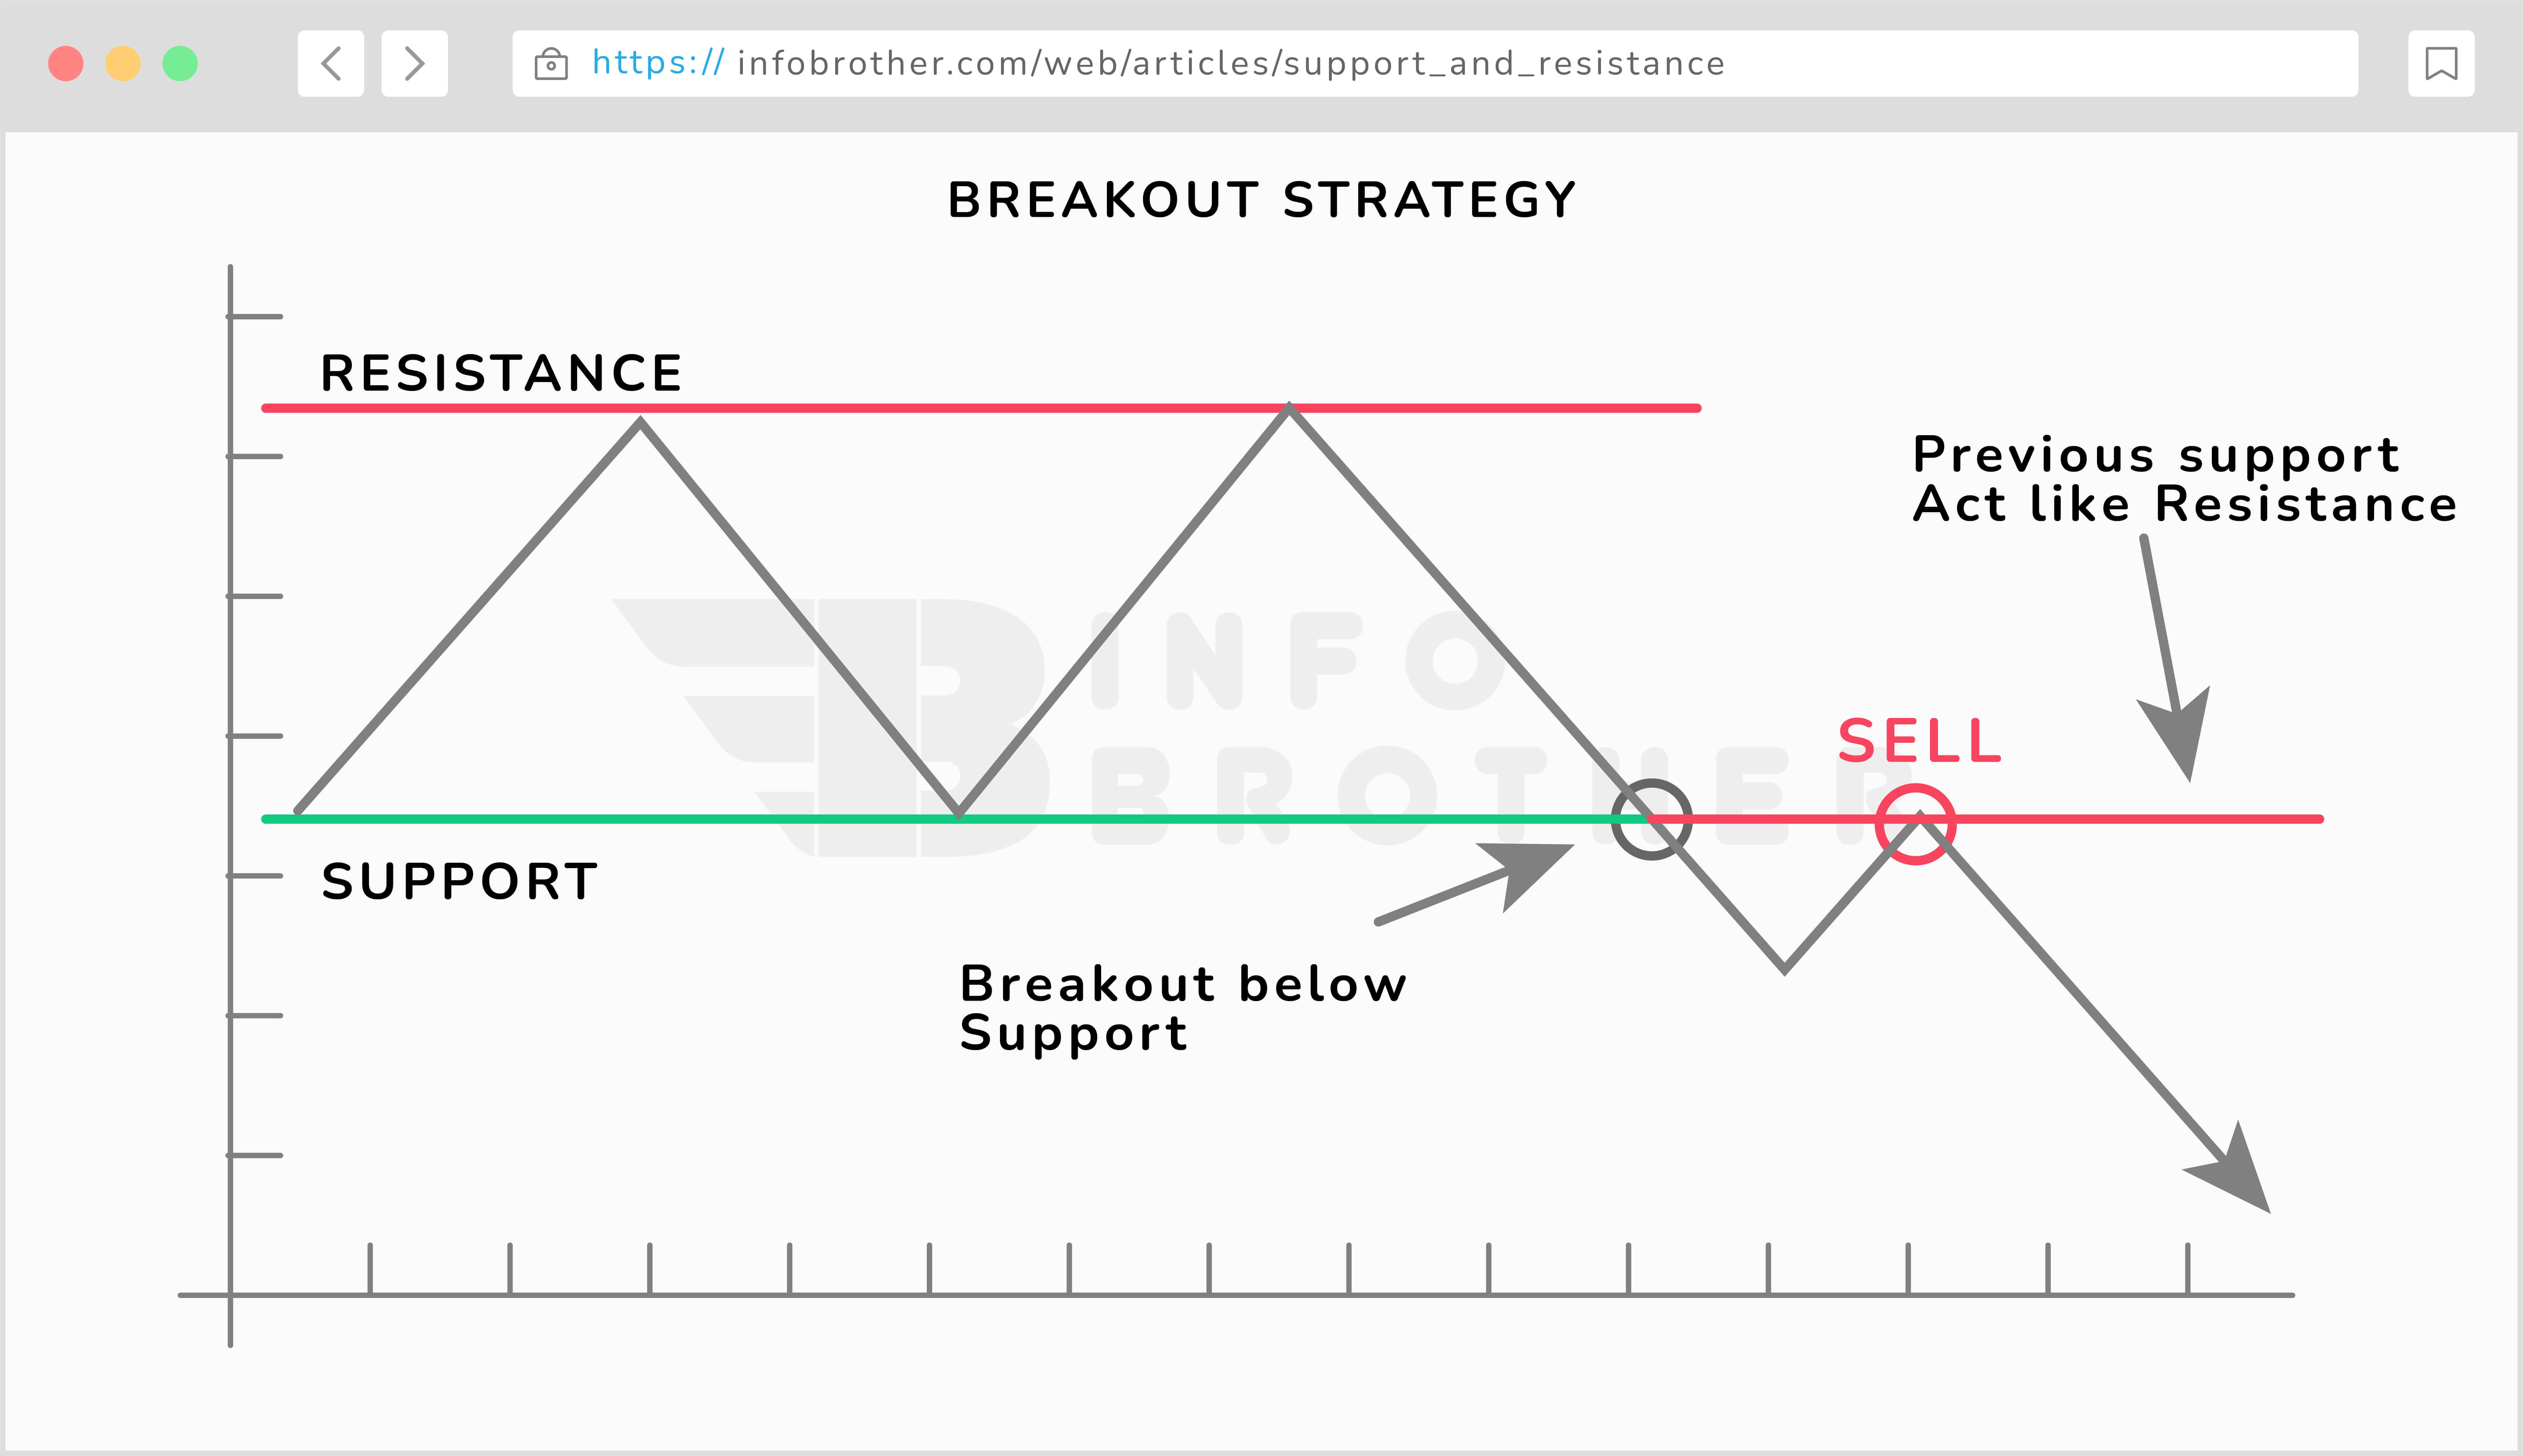
Price will often breakout and start moving after a period of directional indecision. Traders often watch for such breaks below or over support in order to profit from further increased momentum in one direction. If this momentum continues, it has the potential to spark a new trend.
Top traders, on the other hand, prefer to wait for a pullback (towards support or resistance) before entering into a trade in order to avoid falling into the trap of trading a false breakout.
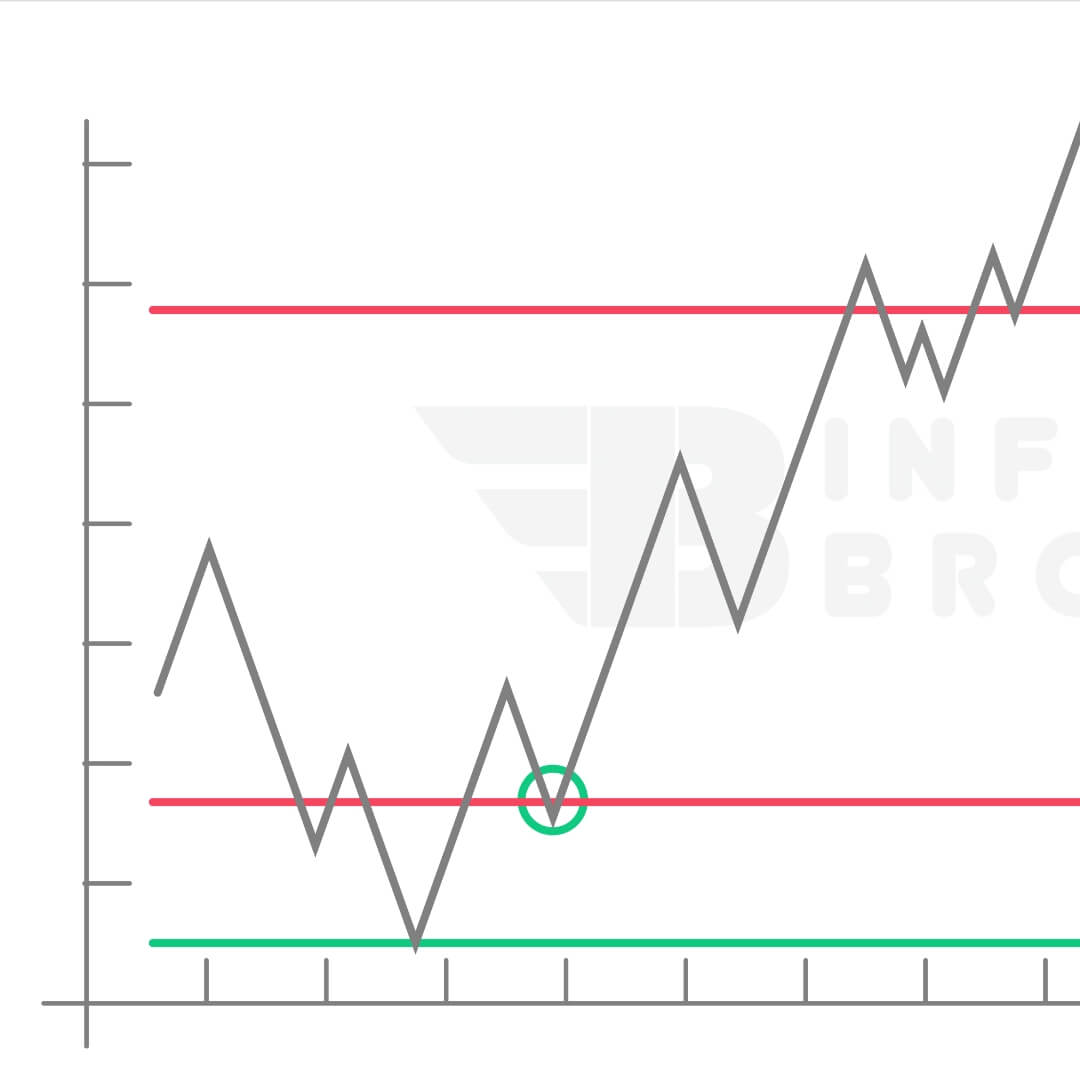
The picture above, for example, illustrates a significant level of support before sellers drove the price below support. Many traders may get enthralled and hurry to initiate a short transaction too soon. Rather, traders should wait for the market reaction (buyers seeking to seize control) to break down before entering a short trade.
In this case, traders should wait for the market to resume its downward trend following the pullback before seeking entry chances.
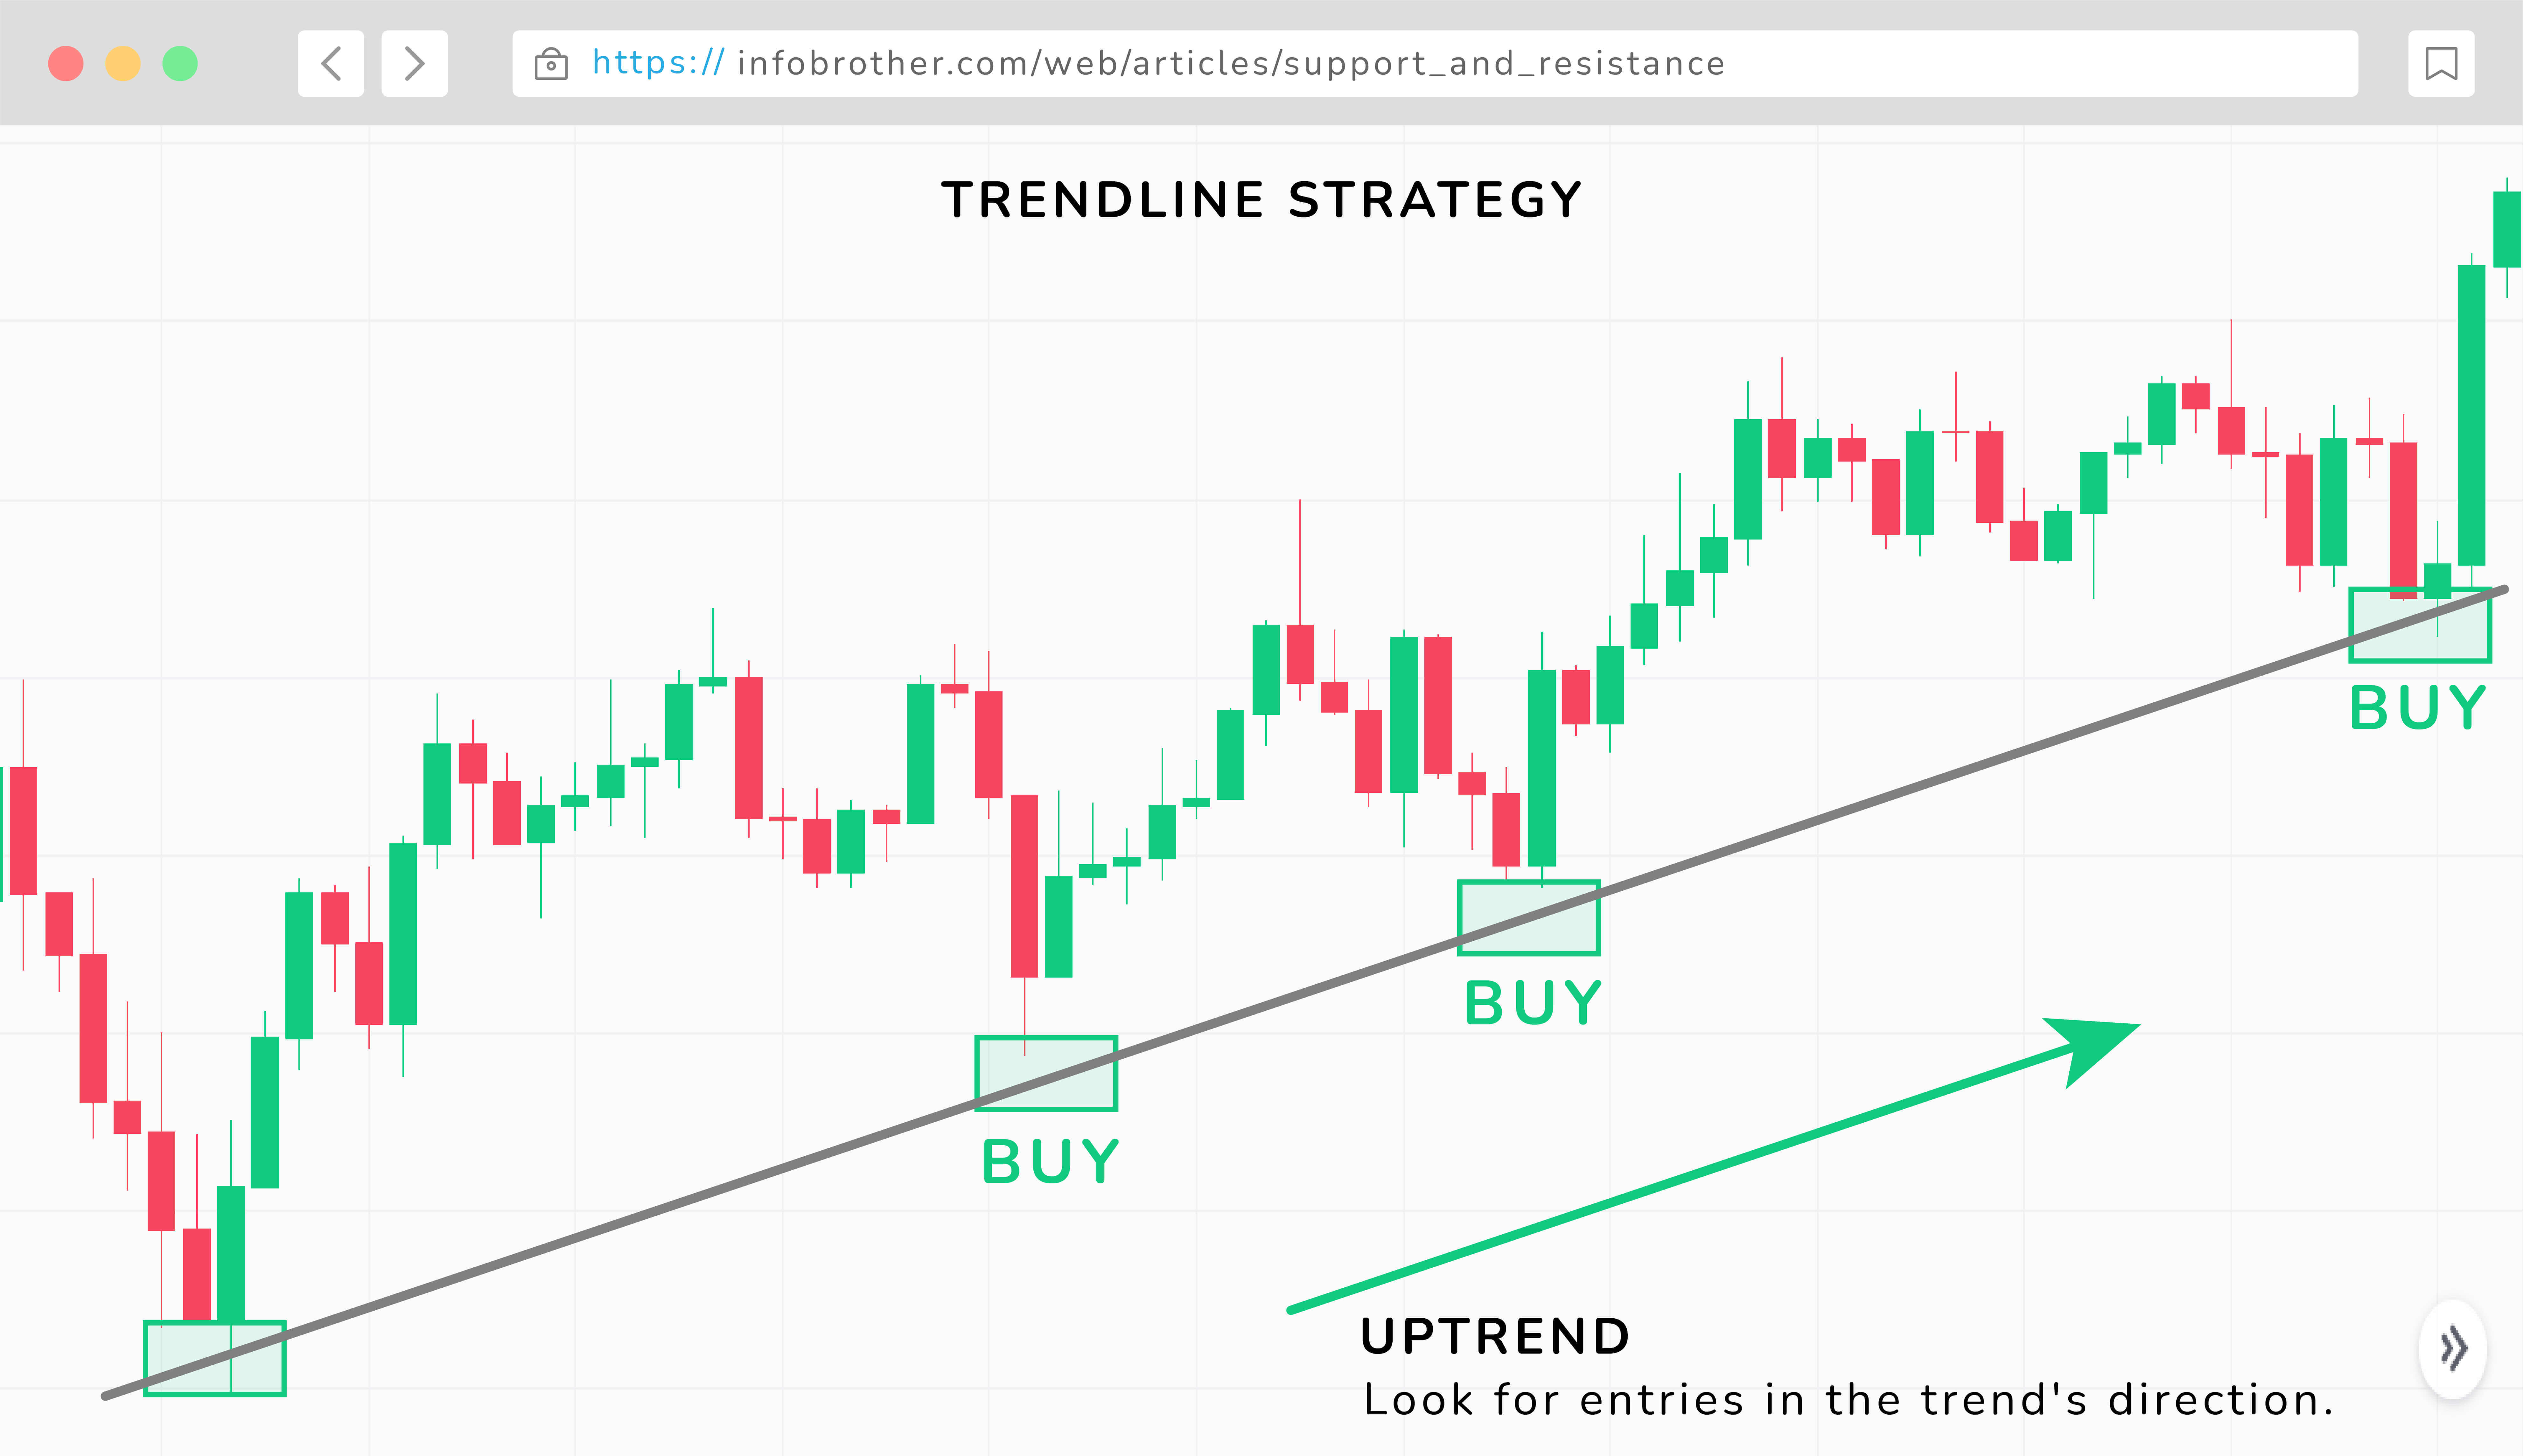
The trendline may be used as support or resistance in the trend-line approach. Simply link two or more highs in a downturn or two or more lows in an upward trend by drawing a line. Price will rebound off the trendline in a strong trend and continue to advance in the trend's direction. As a result, for higher-probability trades, traders should only seek entry in the trend's direction.
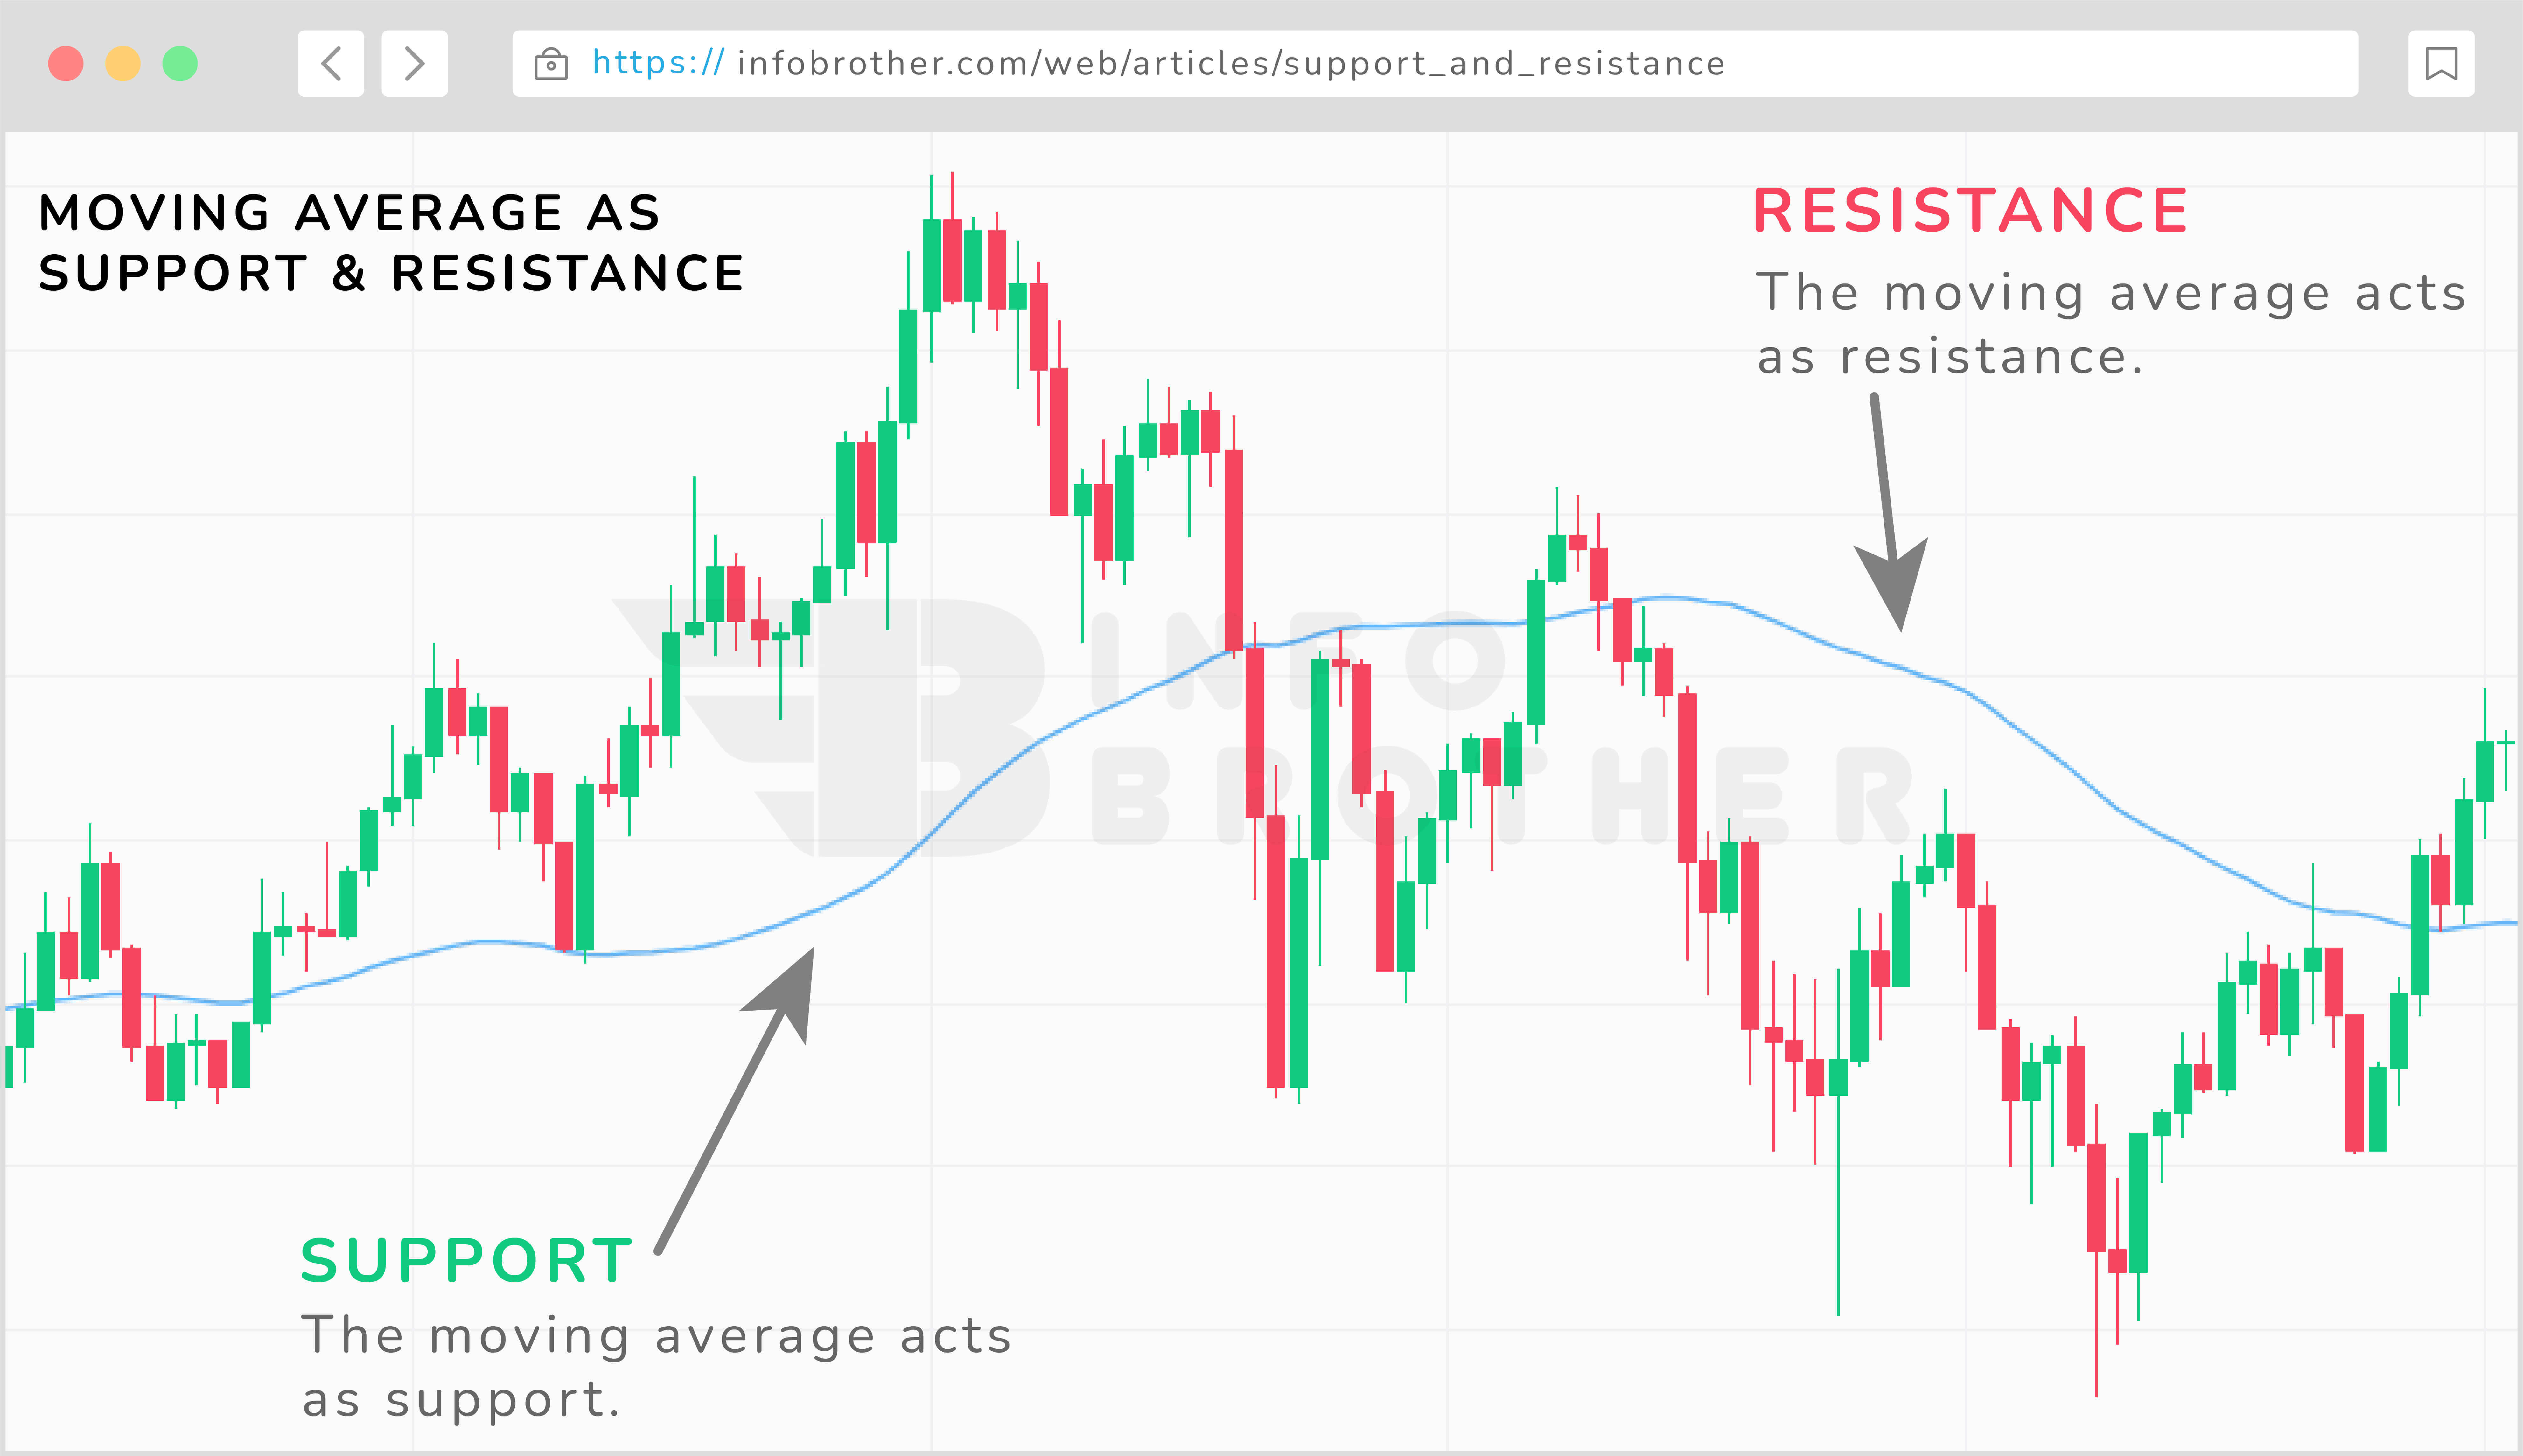
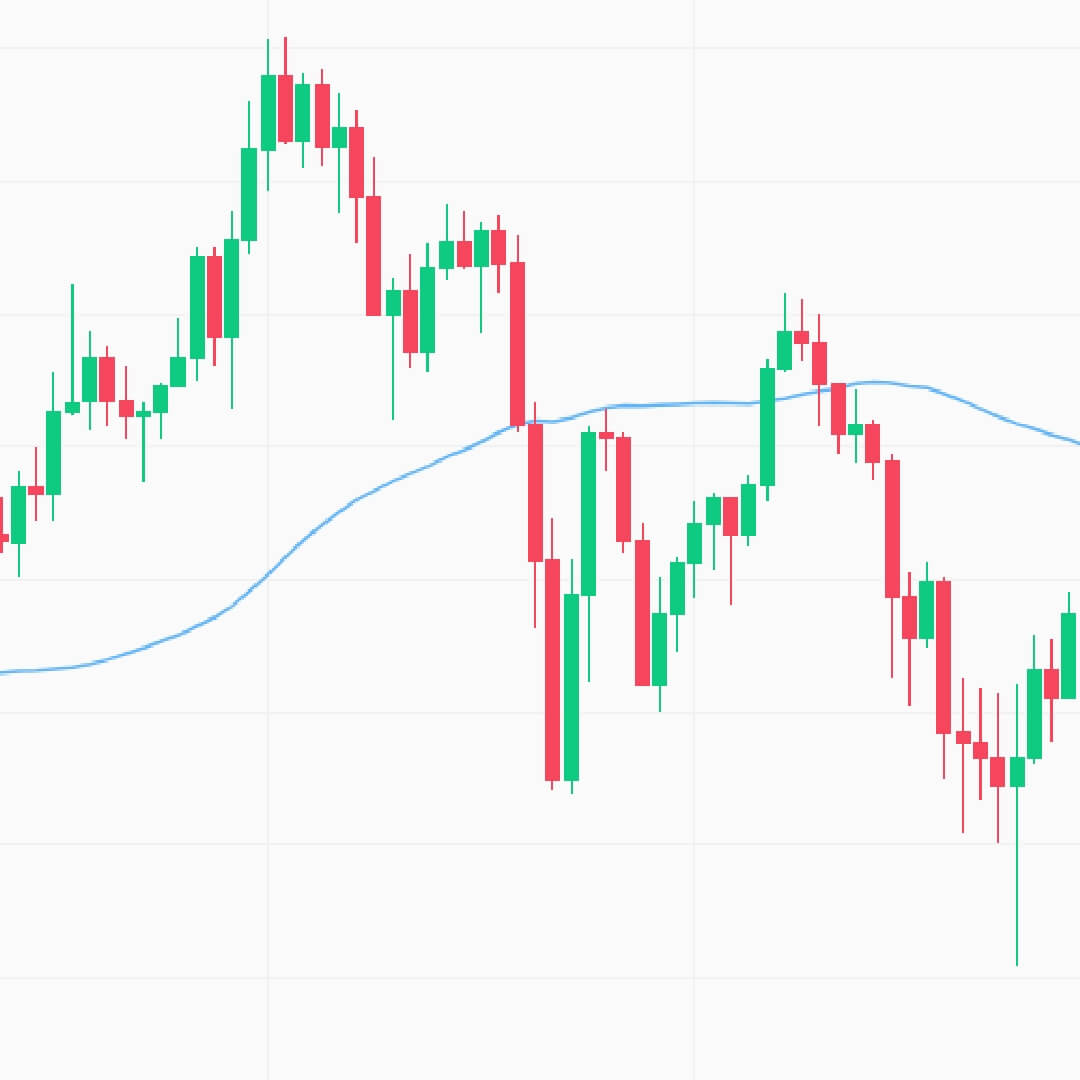
Moving averages may act as dynamic support and resistance in the market. The 20 and 50-period moving averages are popular moving averages to use. Traders often use the 100 and 200 moving averages, and it is ultimately up to the trader to pick a level that they are familiar with.
As seen in the graph above, the 50 moving average (MA) first tracks above the market as a line of resistance. The market then drops and reverses, with the 50 MA serving as dynamic support. Traders may use trendlines to determine which markets are likely to continue trending and which ones are vulnerable to a breakout.