Price Action Trading
Mastering Price Action and Market Structure.
Trading price action examines a securities, indexes, commodities, or currencies behavior in order to forecast what it will do in the future. We may want to take a long position if our price action research indicates that the price is going to climb, or we may want to short the asset if we feel the price is about to fall.
Looking at patterns and finding significant indications that may have an influence on our investments are all part of learning how to trade price action. We'll go through what price action trading is, how to recognize the market, and how to trade it in this post. Following that, we'll go through some of the most crucial chart patterns.
Price position is one of the most significant factors to consider when trading price movement. In the midst of a trend, at the breach of any level, or at support, for example, we notice pattern development and chart patterns.
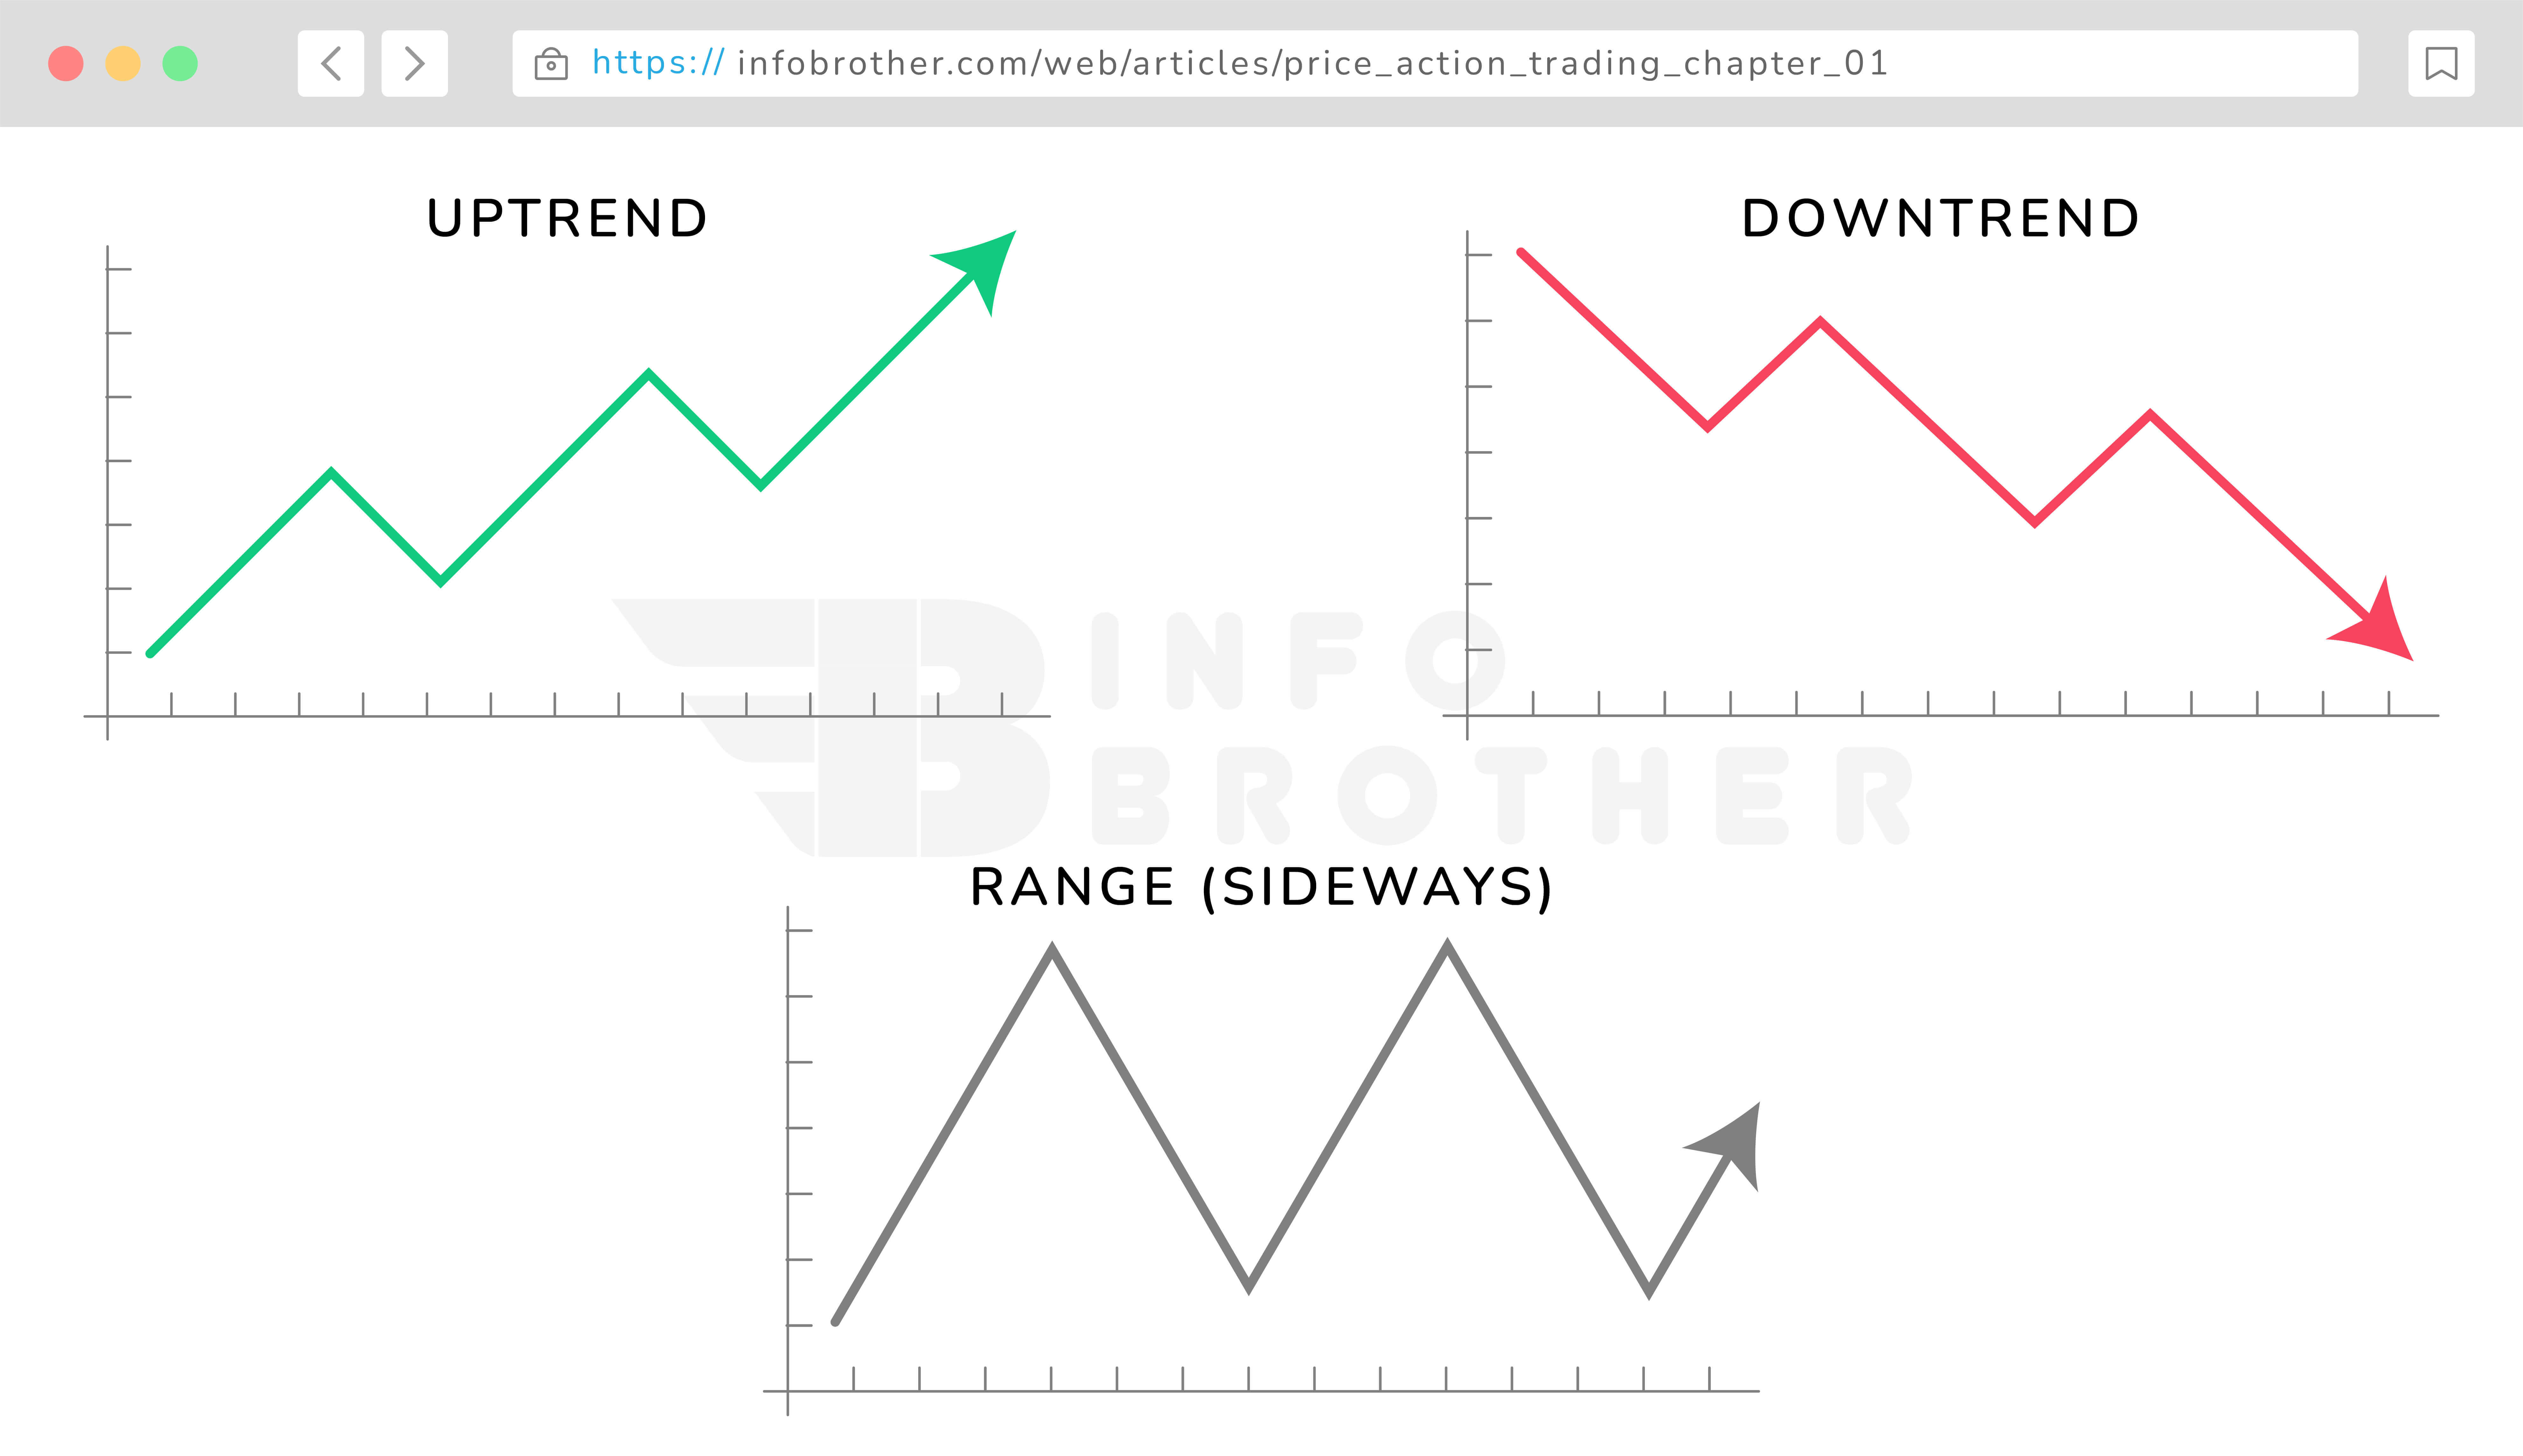
The market structure , whether the market is in an uptrend, downturn, or sideways, is the first thing a price action trader should look at.
When prices are trending, they produce specific highs and lows. We can detect the trend and significant levels by paying attention to the highs and lows.
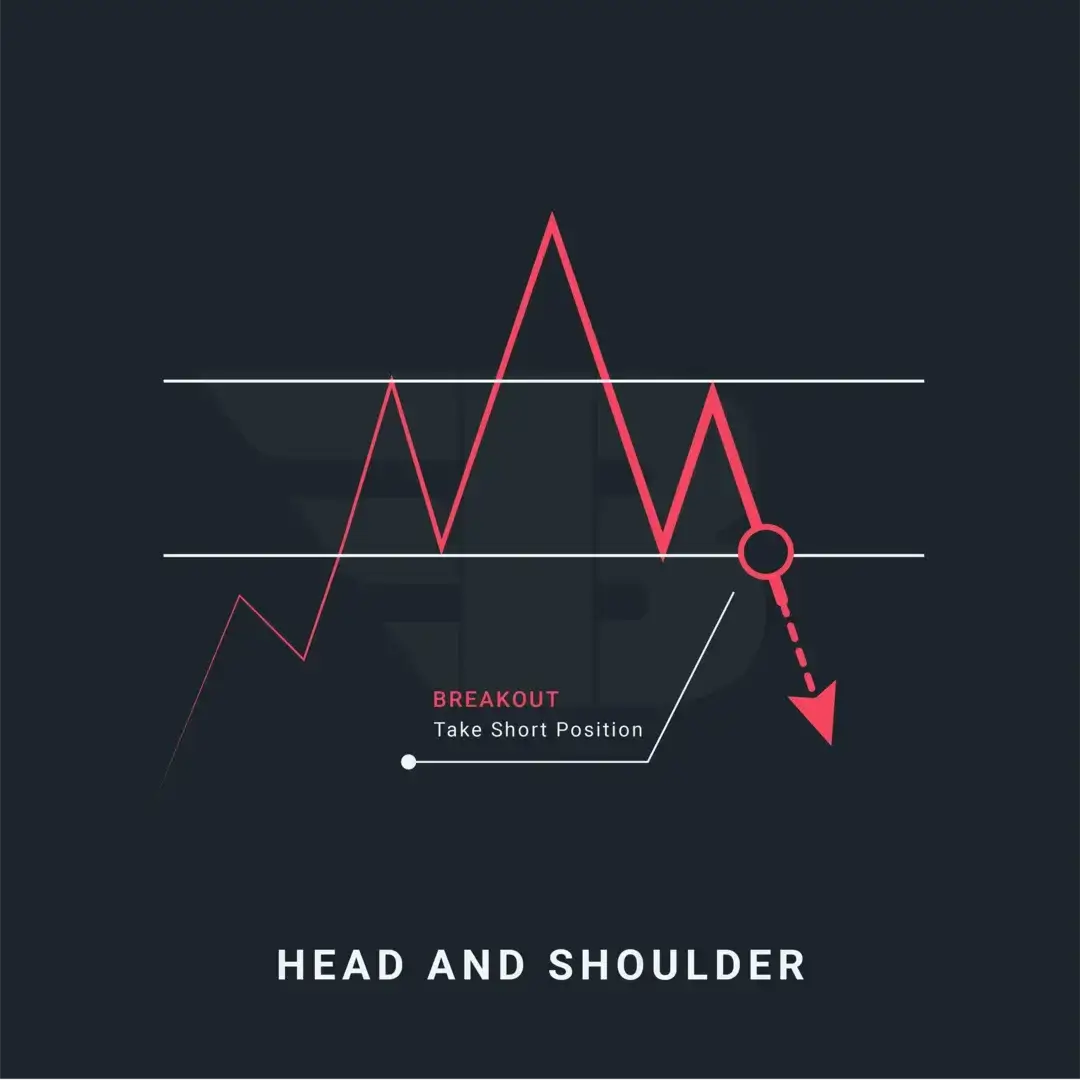
When the market reaches specific levels, we see certain consistent pricing behavior. These behaviors produce patterns known as chart patterns. Patterns include double tops, double bottoms, wedges, head and shoulders, flags, and so on. These patterns represent imbalances between buyers and sellers in the market. We should never rely only on trends while trading.
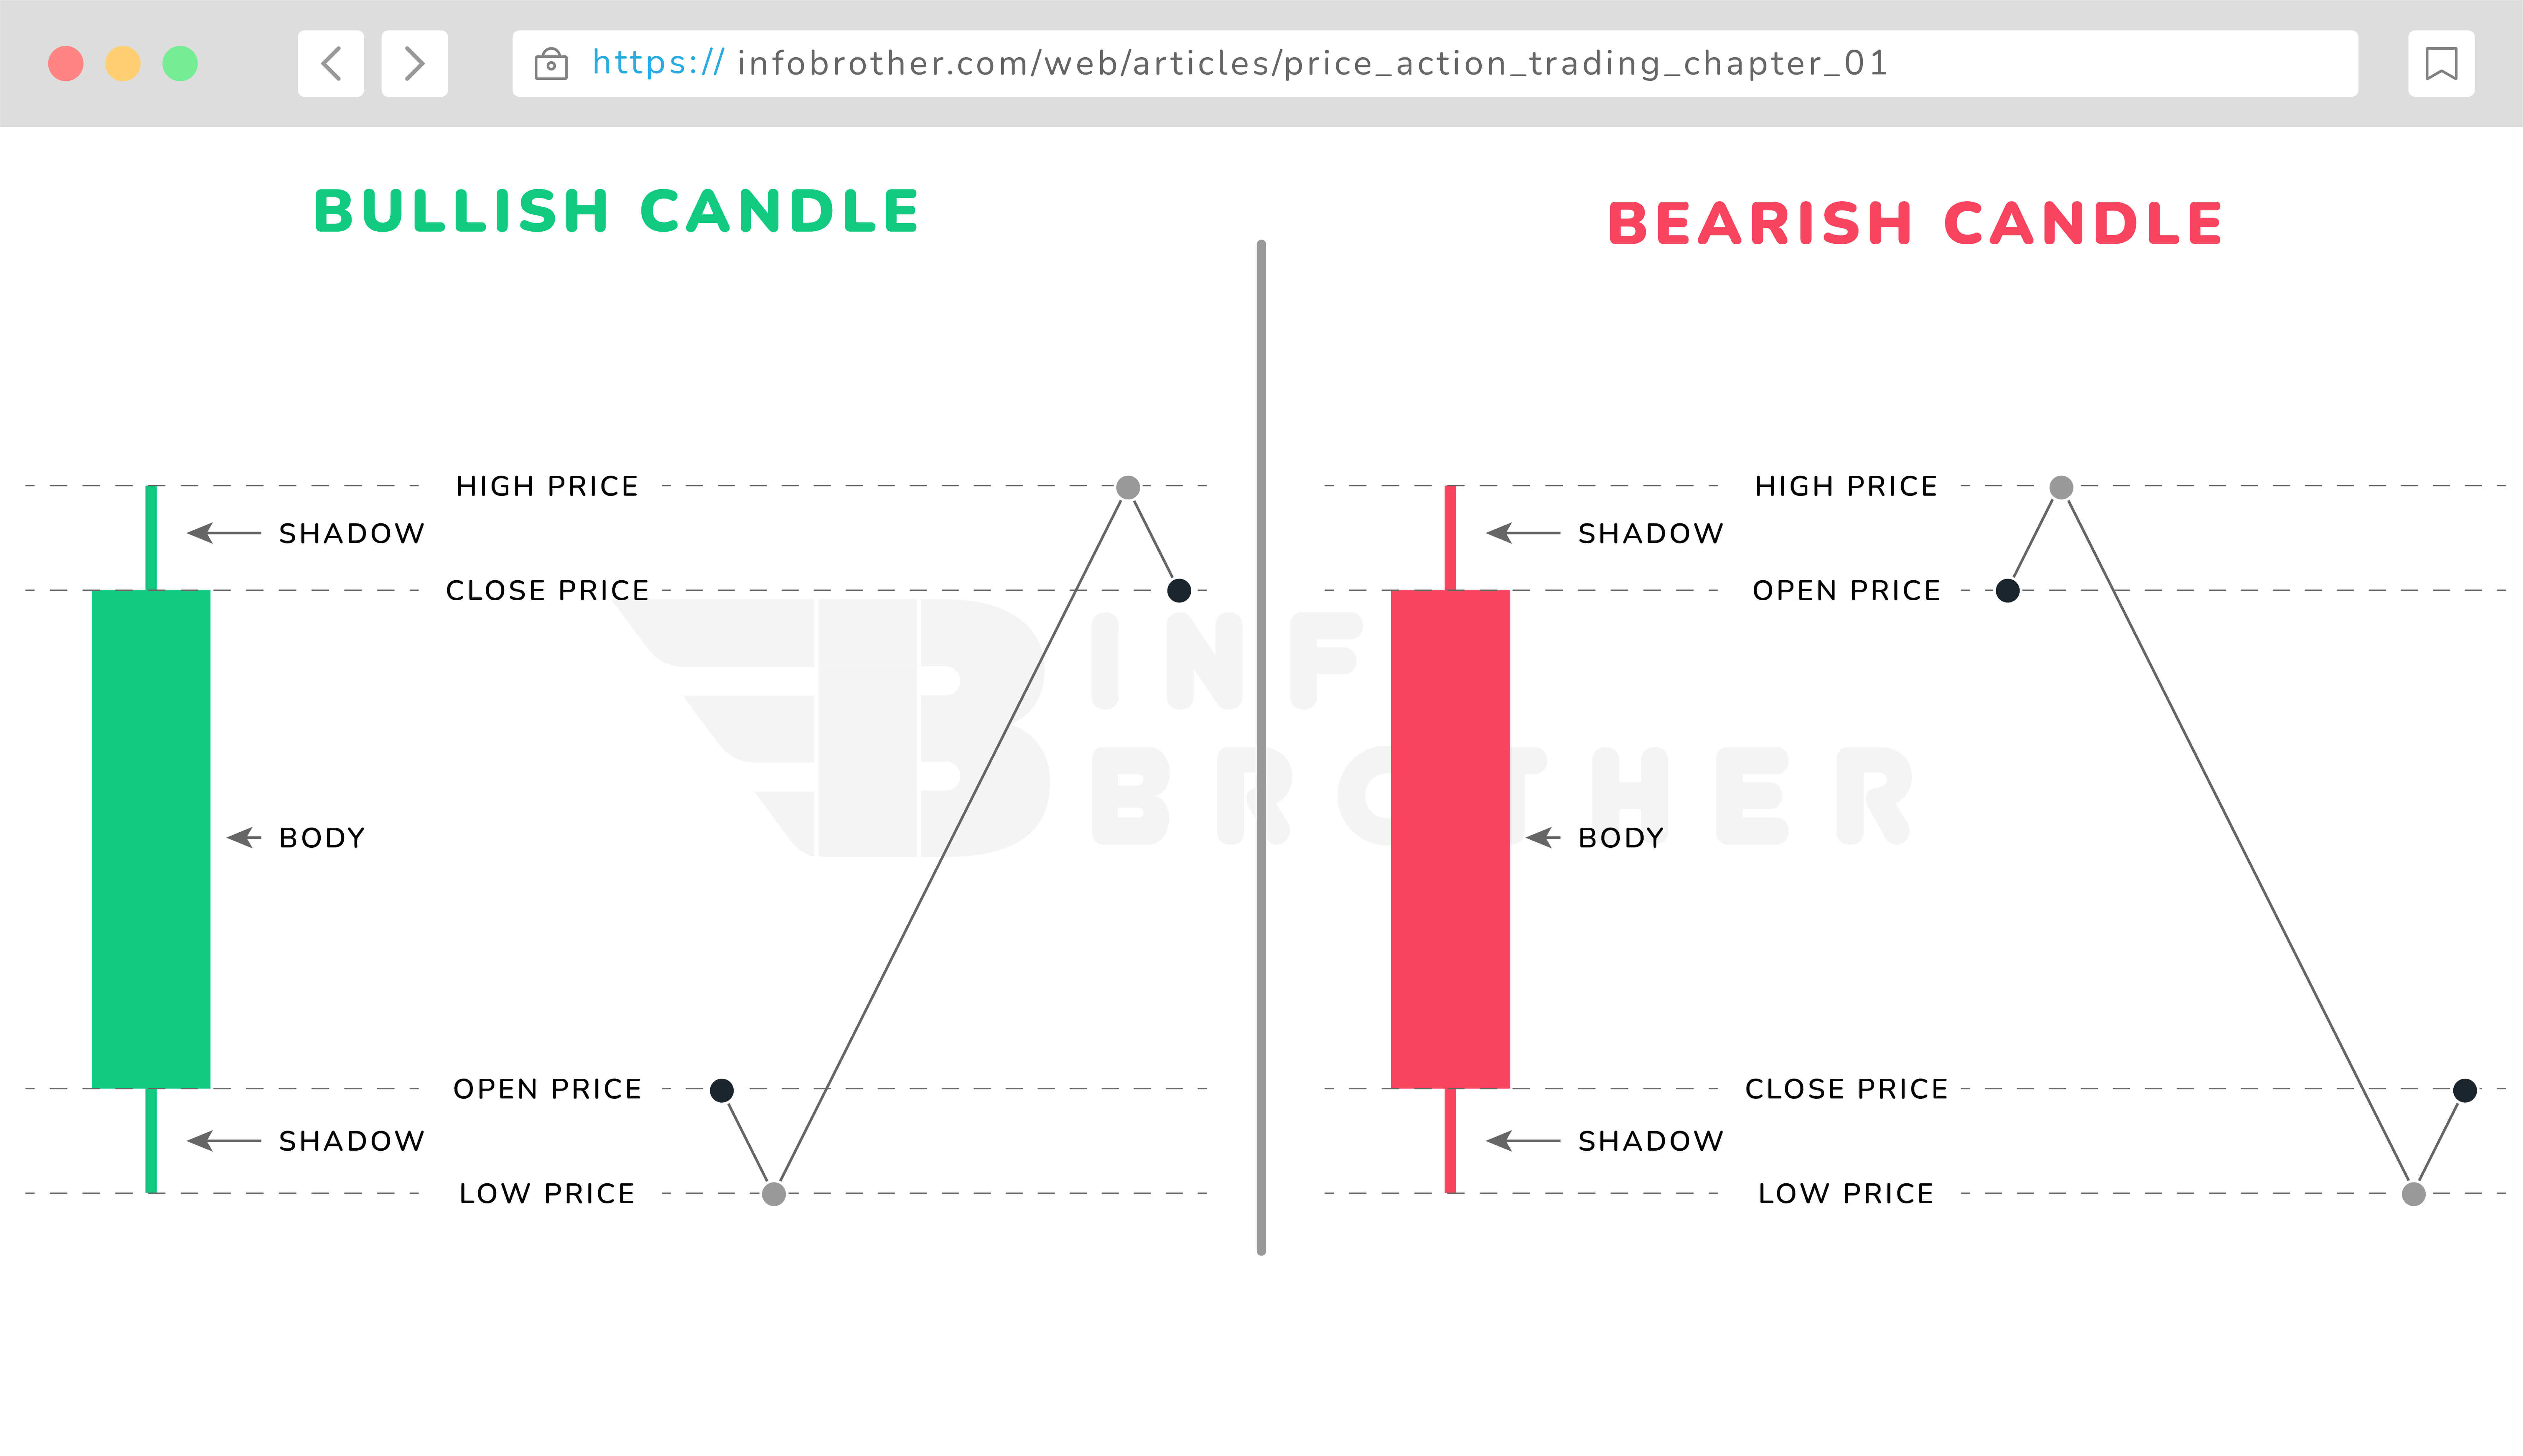
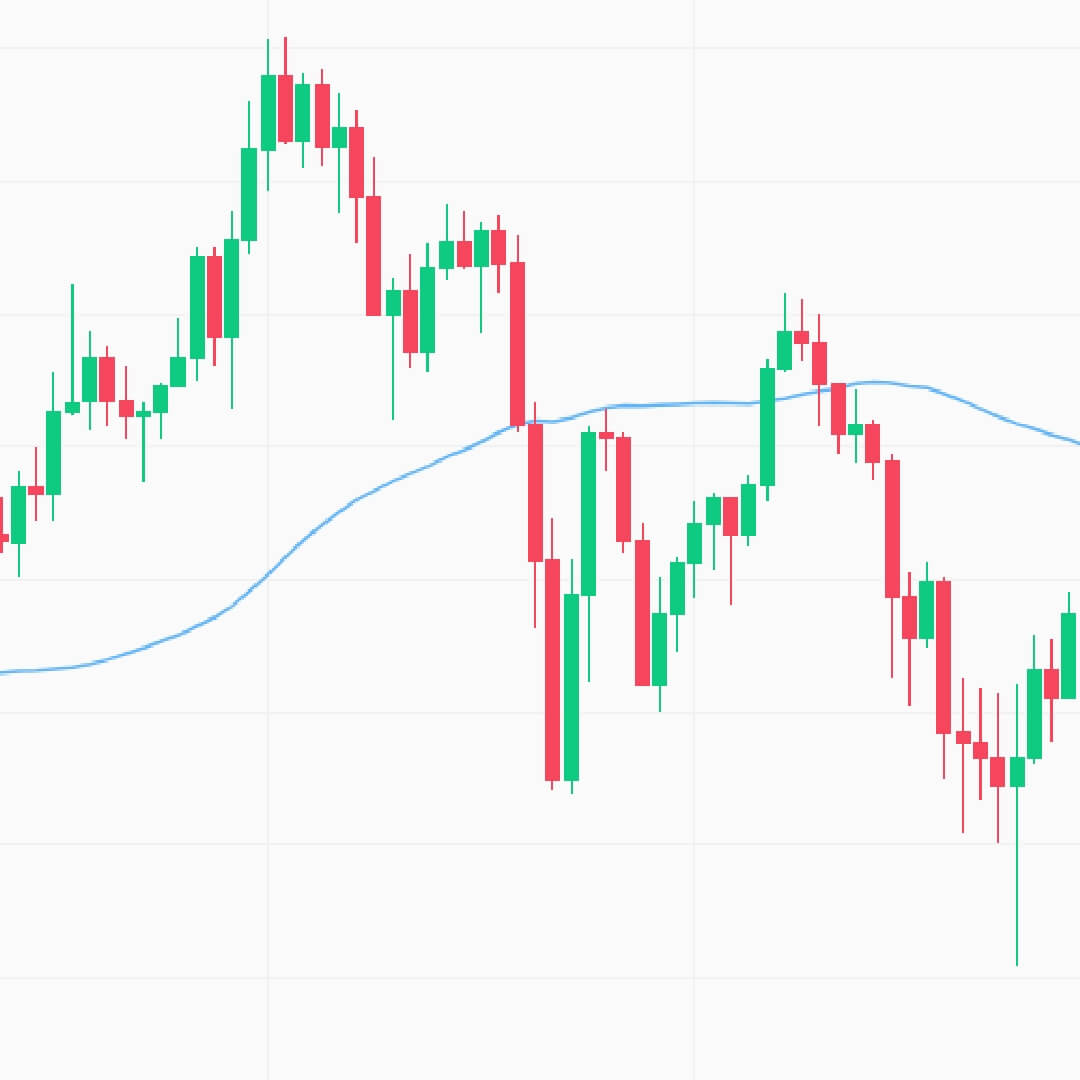
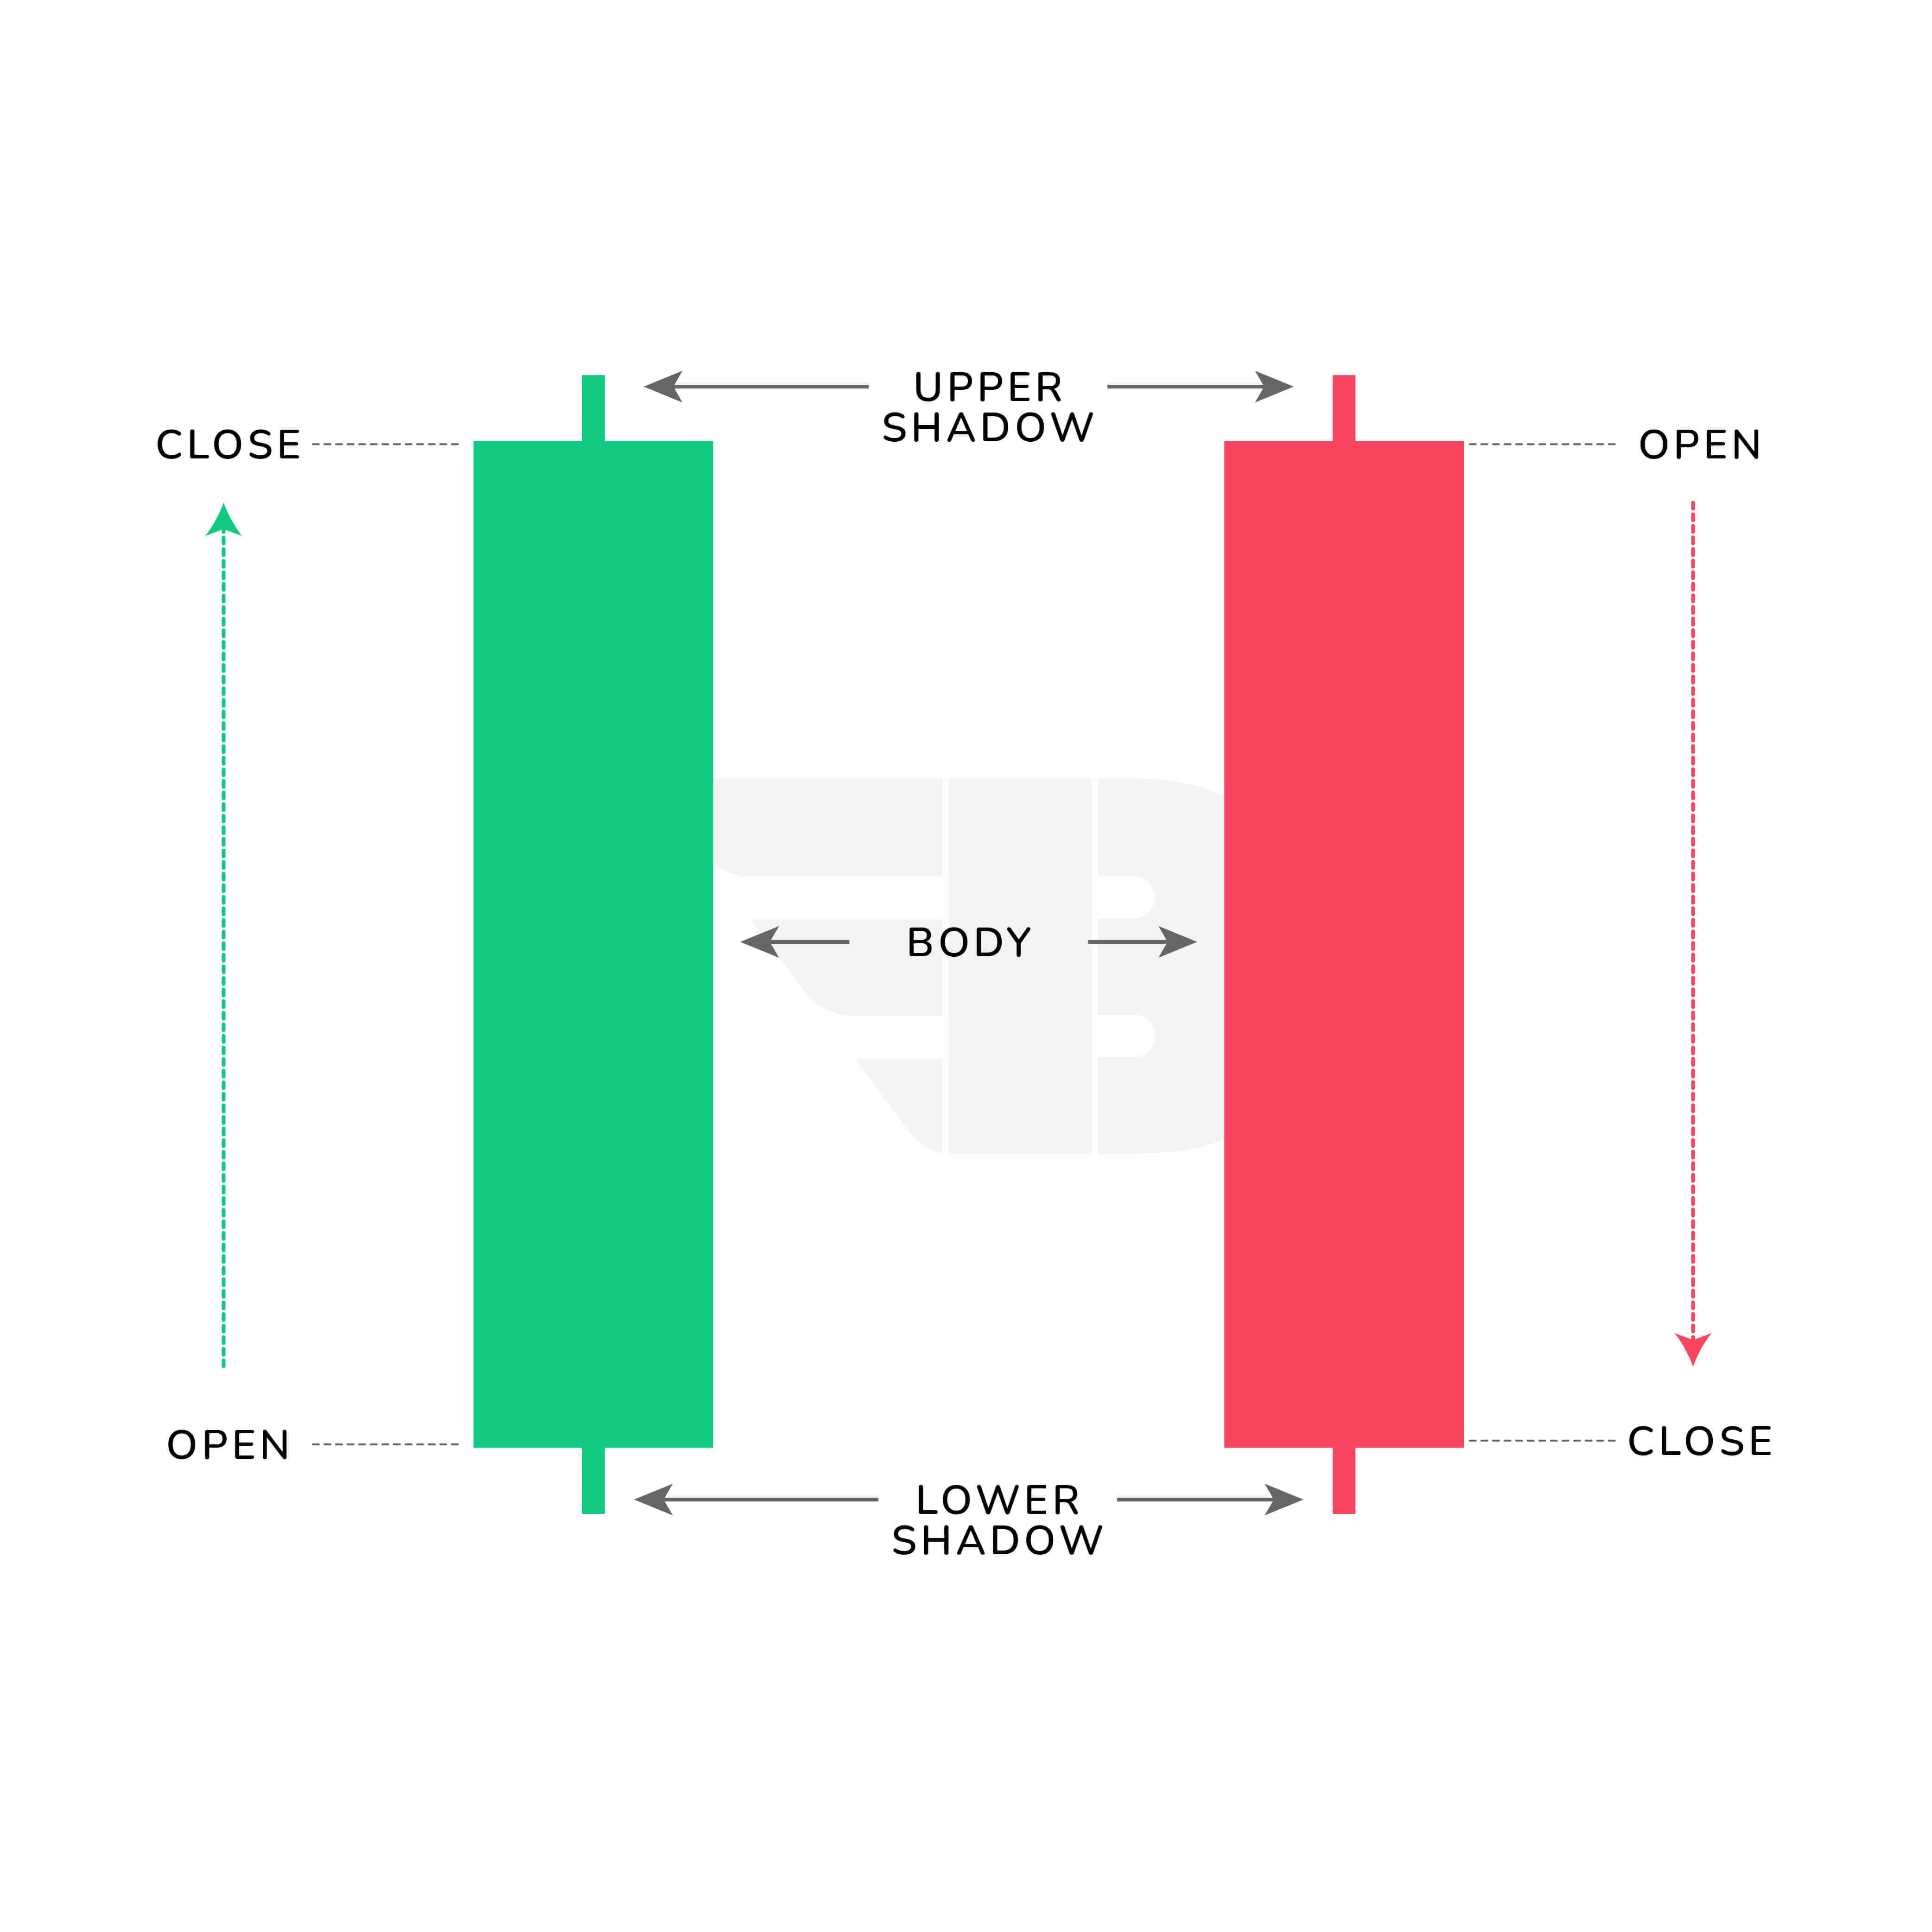
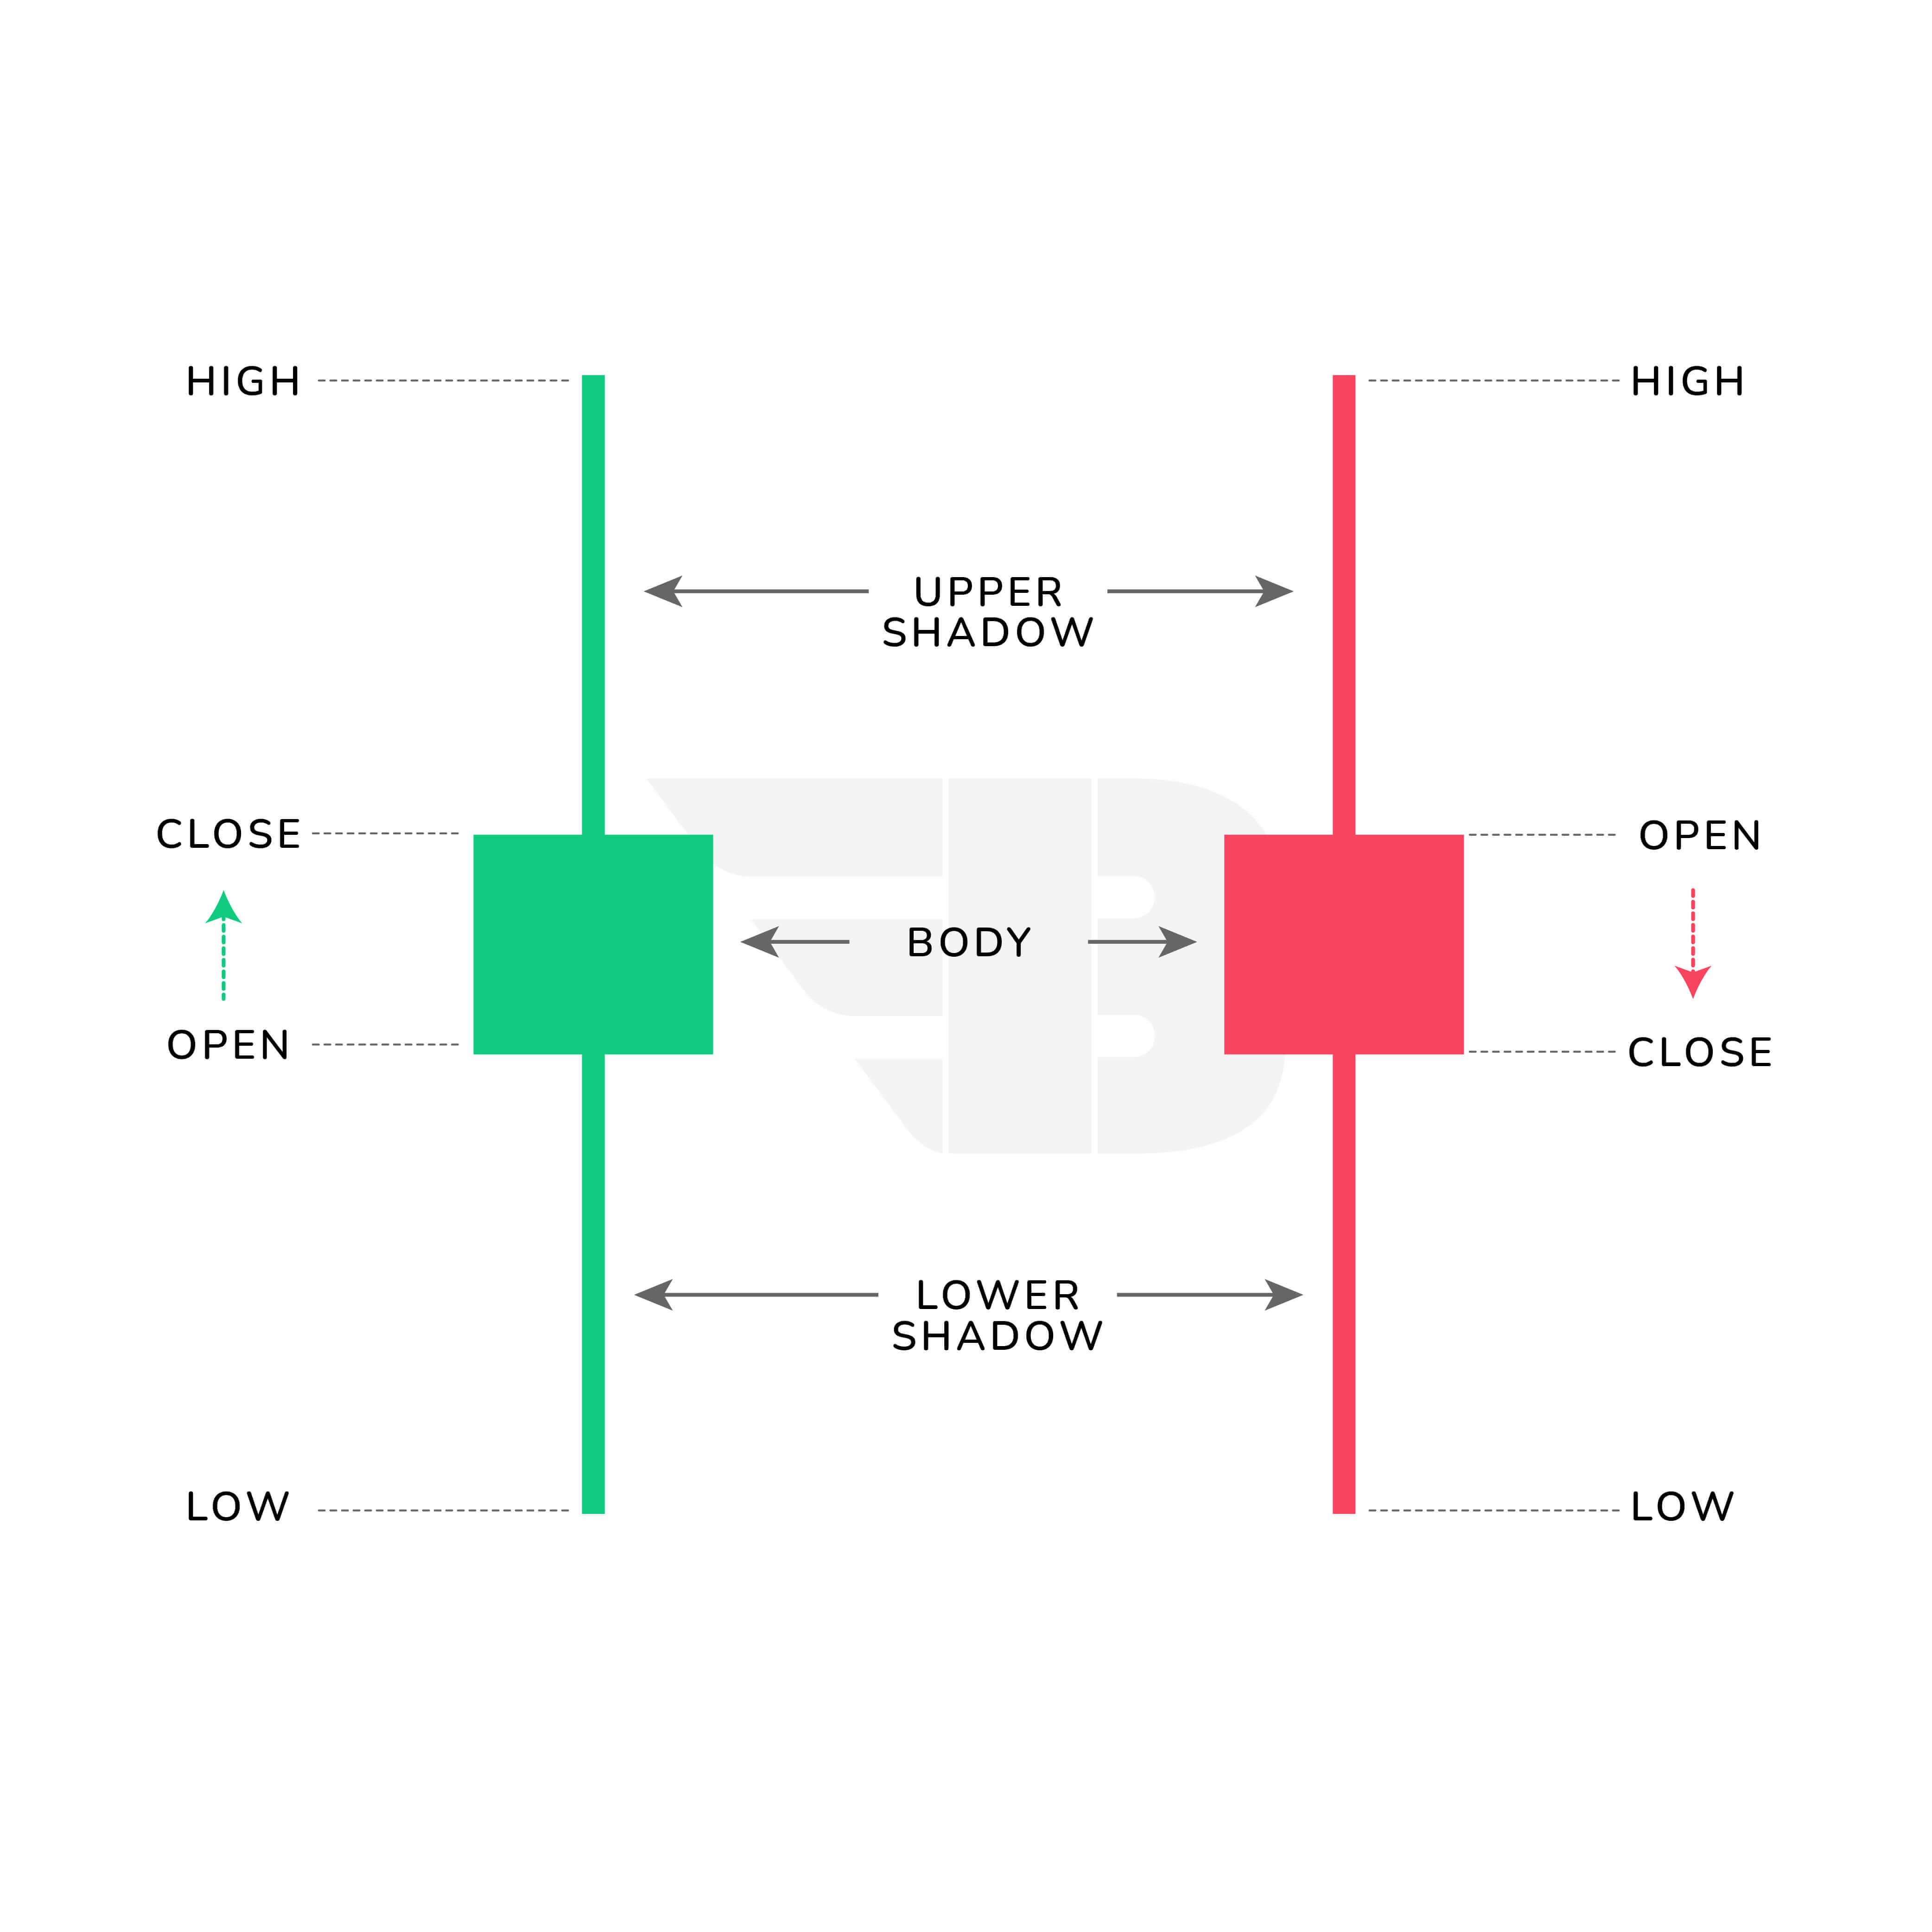
The open, high, low, and closing prices for the day are shown on a daily candlestick chart. The candlestick's body is a rectangular component that depicts the link between opening and closing prices. This body represents the price range between the day's starting and closing prices.
The body of the candle may be red, indicating a bearish candle, or green, indicating a bullish candle. Depending on the trading range, it might be lengthy or short. Shadows, sometimes known as wicks, may be lengthy or short. These shadows indicate the day's peak and low market values. The mix of these shadows and the body represents the market's feeling toward the stock. We must be aware of these characteristics in order to understand how to interpret a candlestick chart.
A candlestick is made up of four parts.
- OPEN:The first trade made within the given time period.
- HIGH:The period's highest trading price.
- LOW:The period's lowest trading price.
- CLOSE:The last trade made within that time period.
Identifying Momentum Candles: Key to Trading Success
Momentum candles have lengthy bodies and small or no upper and lower shadows and are powerful bullish or bearish candles.
Long bodies indicate strong buying and selling forces. If the close is higher than the open, with a long body and short shadows, it indicates that buyers are taking control of the market. If, on the other hand, the close is lower than the open, with a long body and short shadows, it indicates that selling pressure is significant and sellers are in control of the market.
Momentum candles are our entrance candles, and they represent significant momentum in the direction of our trade.
Examples of Momentum Candlestick Pattern:
Understanding Indecision Candles: Market Sentiment Signals
In a trading session, indecision candlesticks suggest that buyers and sellers are active. Long shadows and tiny bodies are often indicative of hesitation in candlestick formations.
Long shadows and little bodies suggest that the buyers and sallers are engaged in combat. Buyers attempted to raise the price but were met with fierce pushback from sellers. Similarly, the sellers attempted to cut the prices from the starting levels, but they were met with significant pushback from the purchasers. The price jumping and ending close to the starting price stemmed from the conflict between sellers and buyers.
Price attempted to move up and down throughout the trading session but was met with severe resistance, as evidenced by the extended shadows on each side and the tiny body. Indecision results from the market's struggle to sustain either higher or lower pricing.
Examples of Indecision Candlestick Pattern:
Wick Rejection Candles: Spotting Market Reversals
A candlestick is made up of a body and a shadow (wick). A candlestick with a little or medium-sized shadow indicates that trade is taking place around the opening and closing prices.
However, a candlestick with long shadows and a tiny body suggests that trading activity is occurring outside of the opening and closing prices and has spread beyond the opening and closing values.
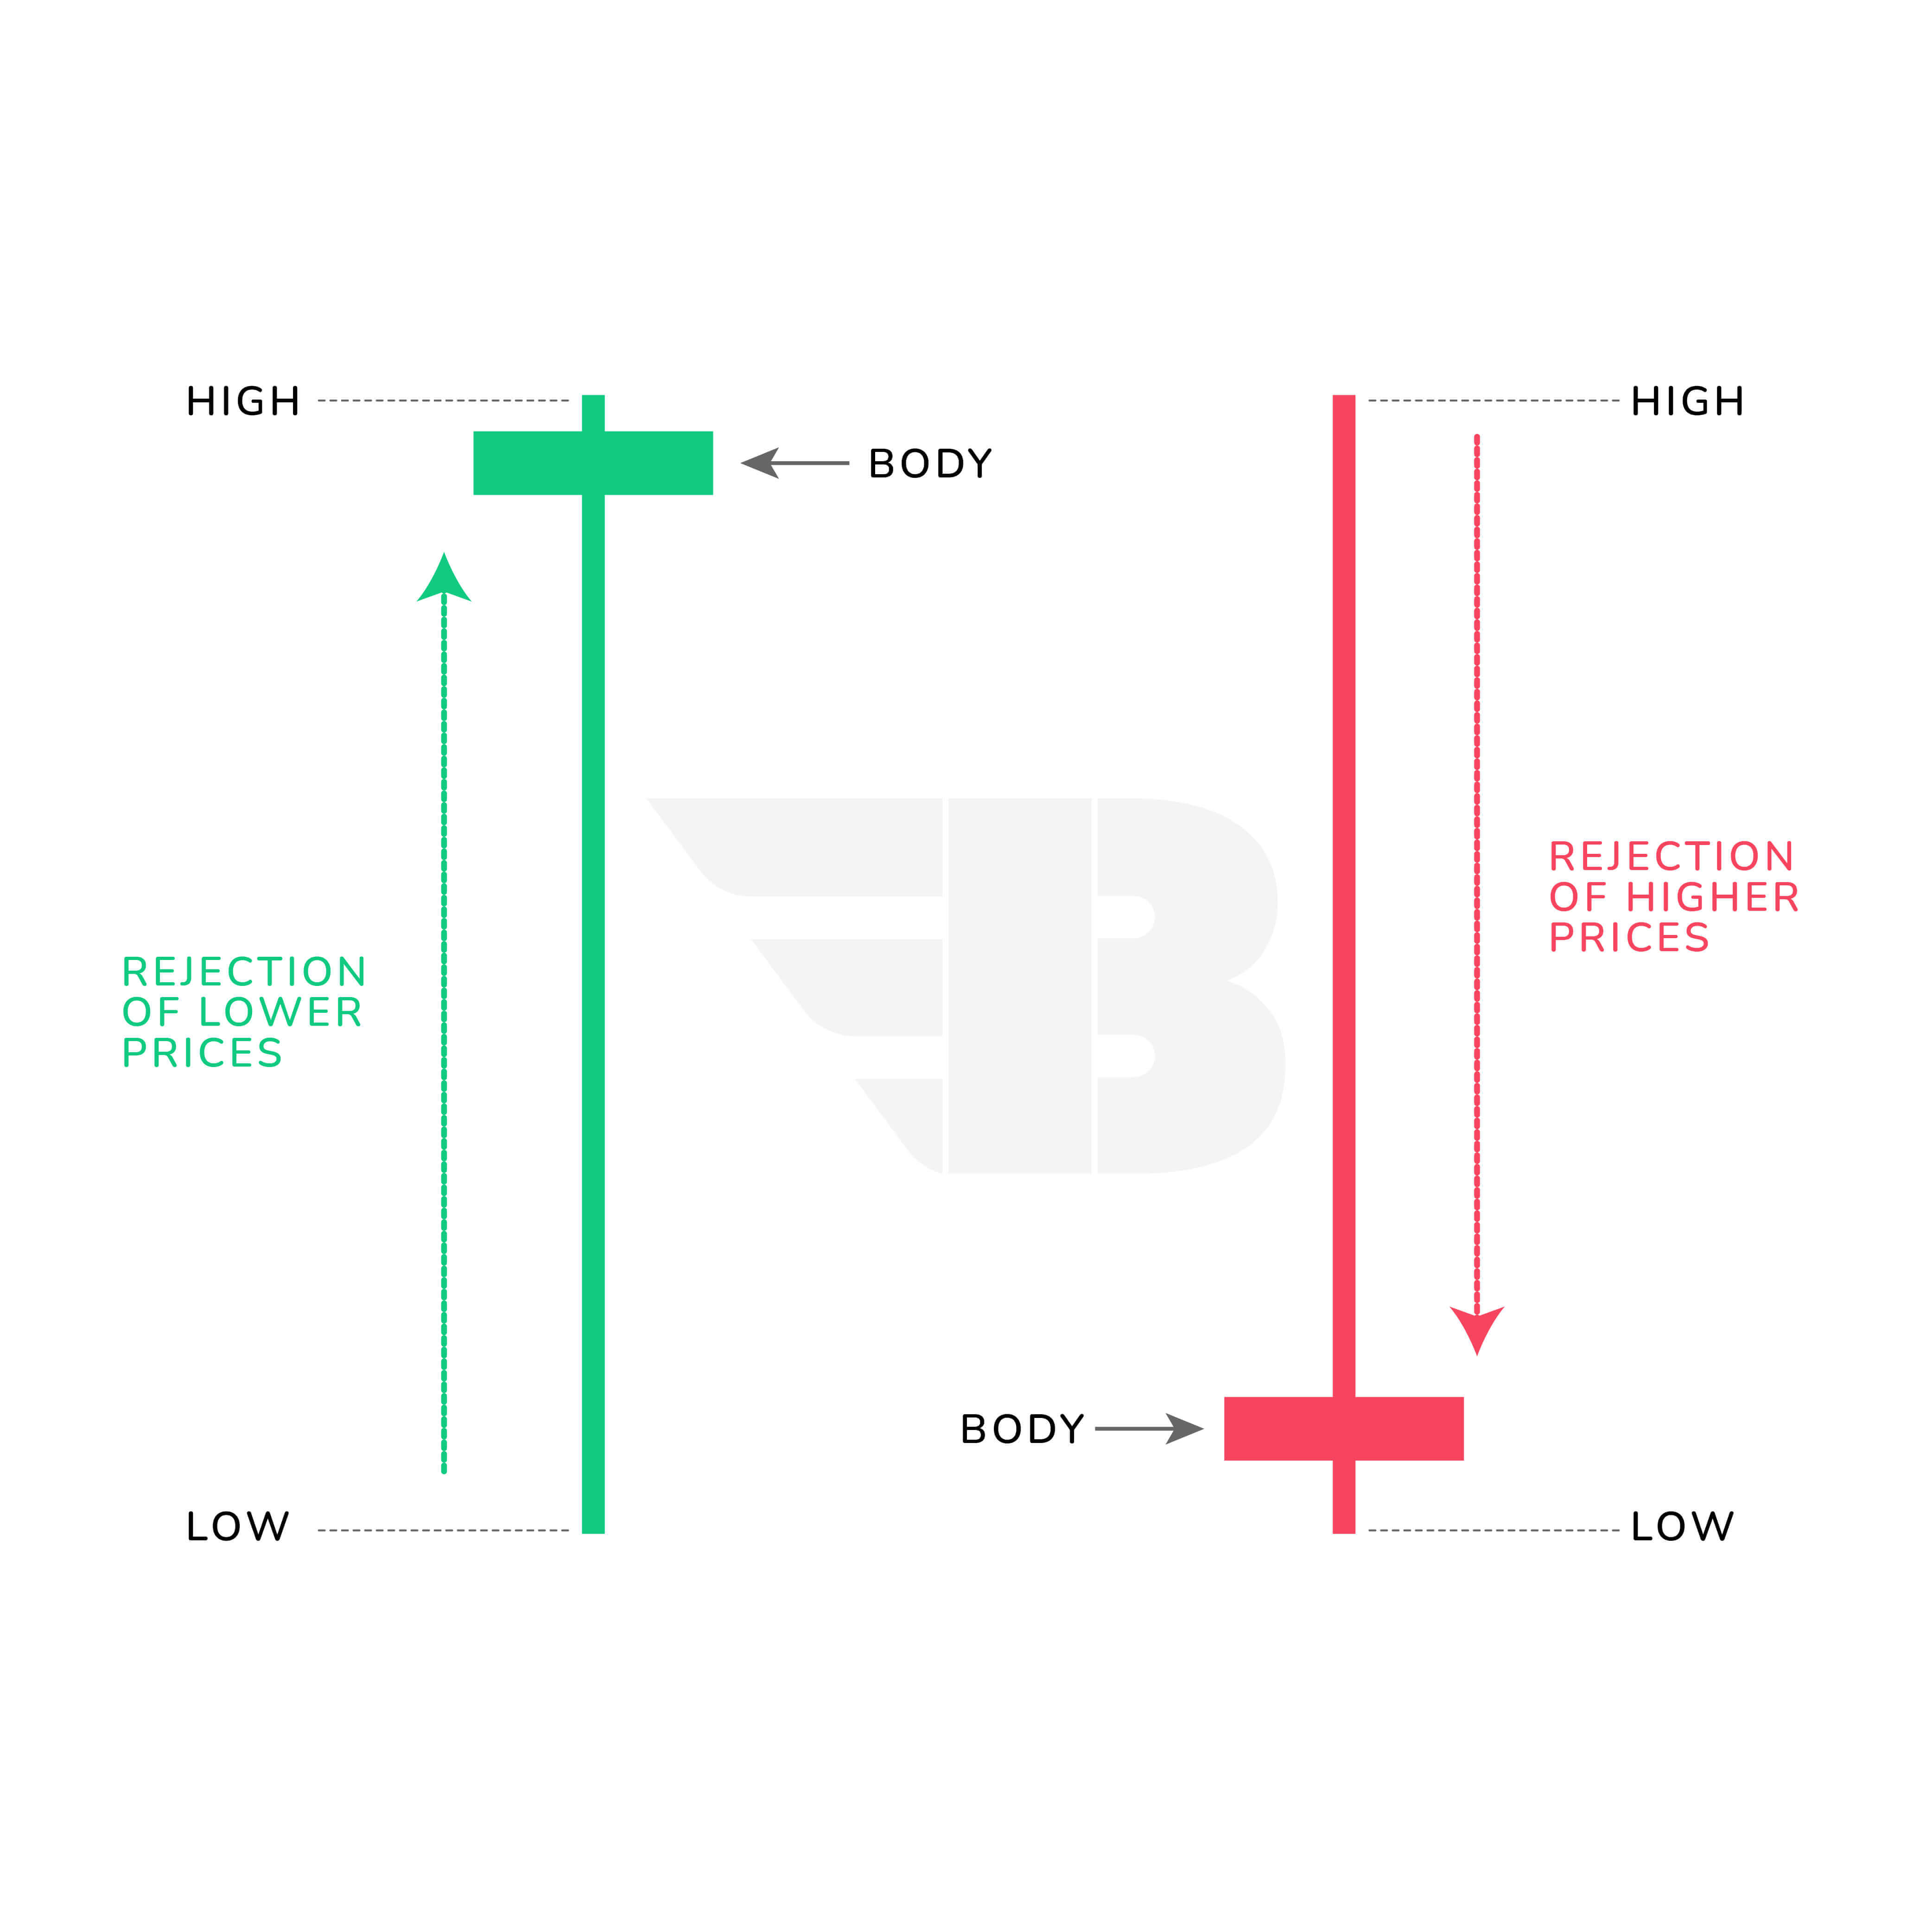
The lengthy shadows candle indicates that the market pushed in one direction but was rejected. A lengthy upper shadow candle is generated by increased purchasing pressure followed by rejection, indicating that the market rejects higher prices.
The bulls join the market and drive the price higher, while the bears enter the market and push the price down, leaving lengthy upper shadows and closing the price close to the starting price.
A lengthy lower shadow candle, on the other hand, is generated by increased selling pressure and subsequent rejection, and it indicates that the market rejects lower prices. Bears join the market, raise selling pressure, and drive prices lower, but they finally lose to buyers, and prices begin to climb by leaving the extended downward shadow.
Examples of Wick Rejection Candlestick Pattern:
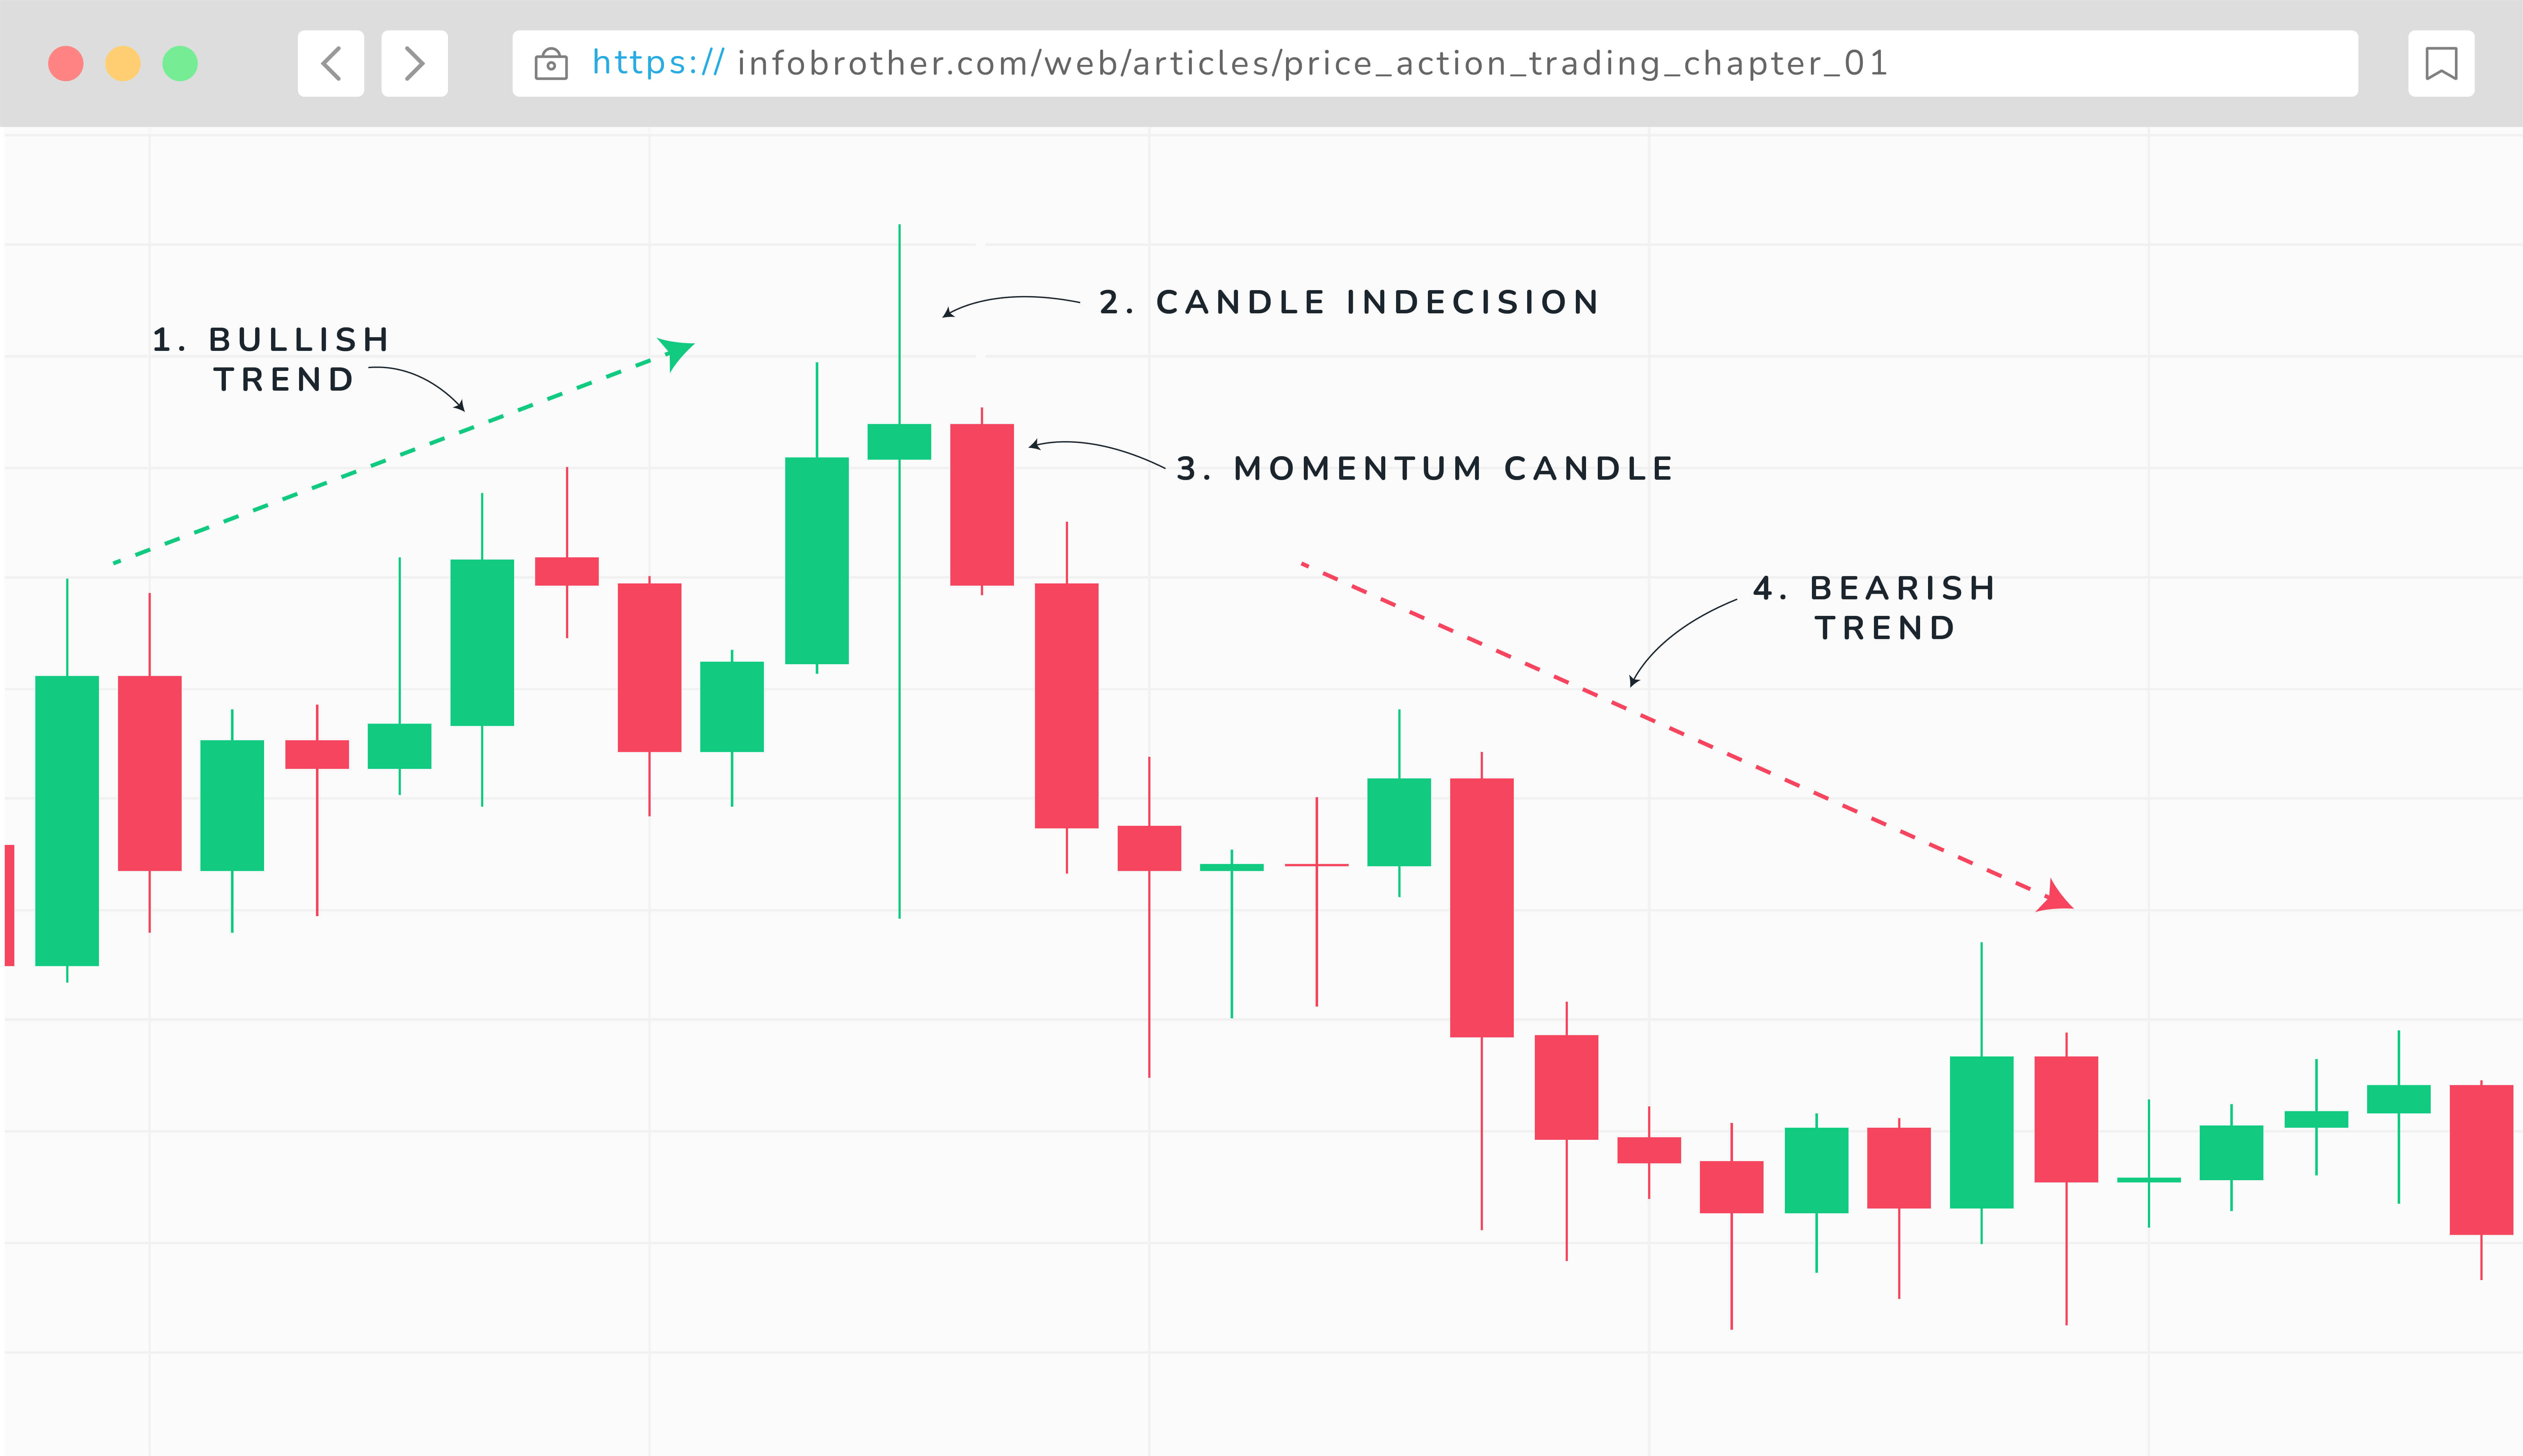
One of the most significant factors to consider for effective trading is candlestick behavior analysis. Prices are being driven up and down by bulls and bears. The bulls raise purchasing pressure and push the price higher, while the bears join the market and drive the price down and maintain market dominance.
The market has been on an upswing for a few days, and a 'candle indecision' appears in the above chart, indicating an imbalance between the bulls and bears. Long shadows and little body hint that the buyers and sallers are fighting. Buyers sought to boost the price, while sellers resisted strongly. Similarly, the sellers sought to lower the prices from the outset, but were greeted with strong opposition from the buyers. The dispute between sellers and purchasers caused the price to rise and finish close to the beginning point.
The following day, a strong bearish momentum candle appears, indicating that a significant downturn is on the way.
A trading edge is also one of the most crucial aspects of trading. A trading edge is a particular method, observation, or specific technique that provides a trader with a cash-generating advantage over other market participants. We must develop a trading strategy and plan that has a high win rate across a series of deals. Above all, we must be disciplined in the markets.
Every advantage we have as technical traders stems from a misallocation of buying and selling forces. If we recognize this and restrict our activity in the market to areas where there is a genuine imbalance, we have a chance of profiting. These imbalances may be identified by the patterns they generate in pricing, and these patterns can supply us with knowledge that we can utilize to make trades.
Remember, we trade the underlying imbalances that cause market patterns, not the patterns themselves.
How to find an edge in the market?
Understanding and discovering an edge may help us decide whether it's worth our time and effort to find one, as well as whether it's accessible and beneficial. We don't find the edge all at once, and it doesn't happen immediately. It's been a long process of learning what works and what doesn't work for us.
We must commit a large amount of time and attention to fine-tuning our strategy and honing our craft in order to identify our advantage. It is critical to monitor continuous performance as markets adjust and our experience grows. It is vital that you go through with this operation.
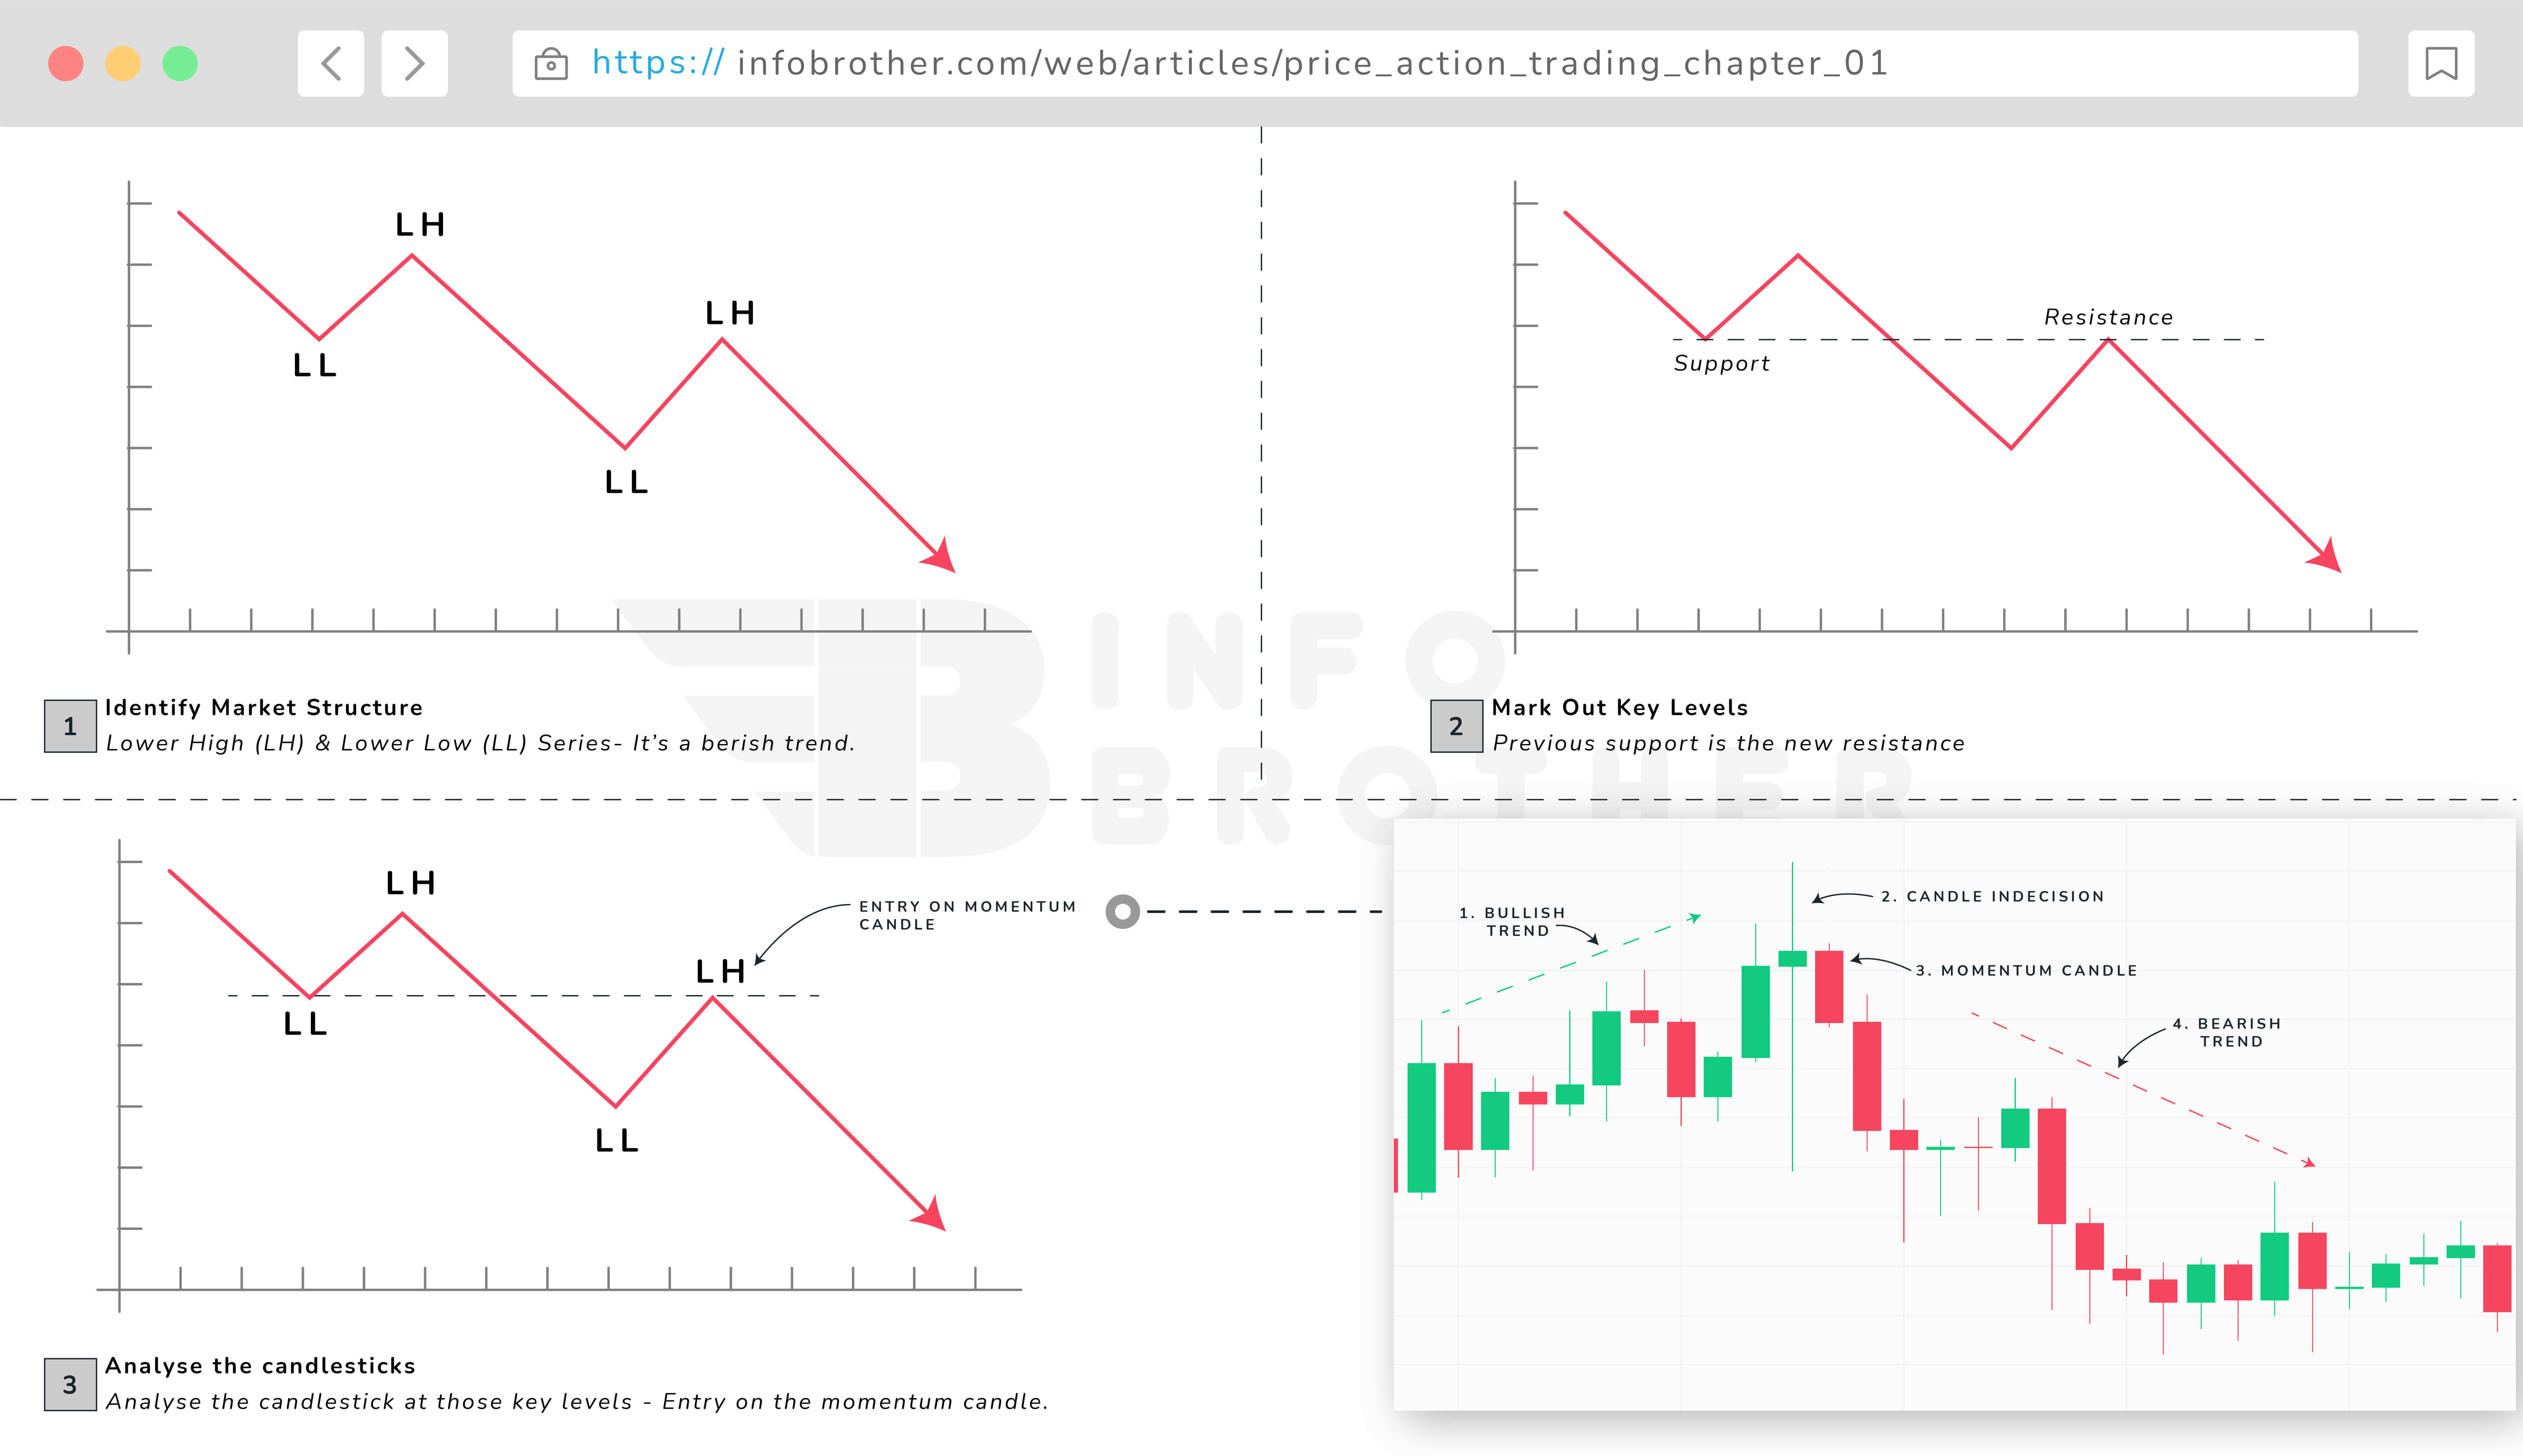
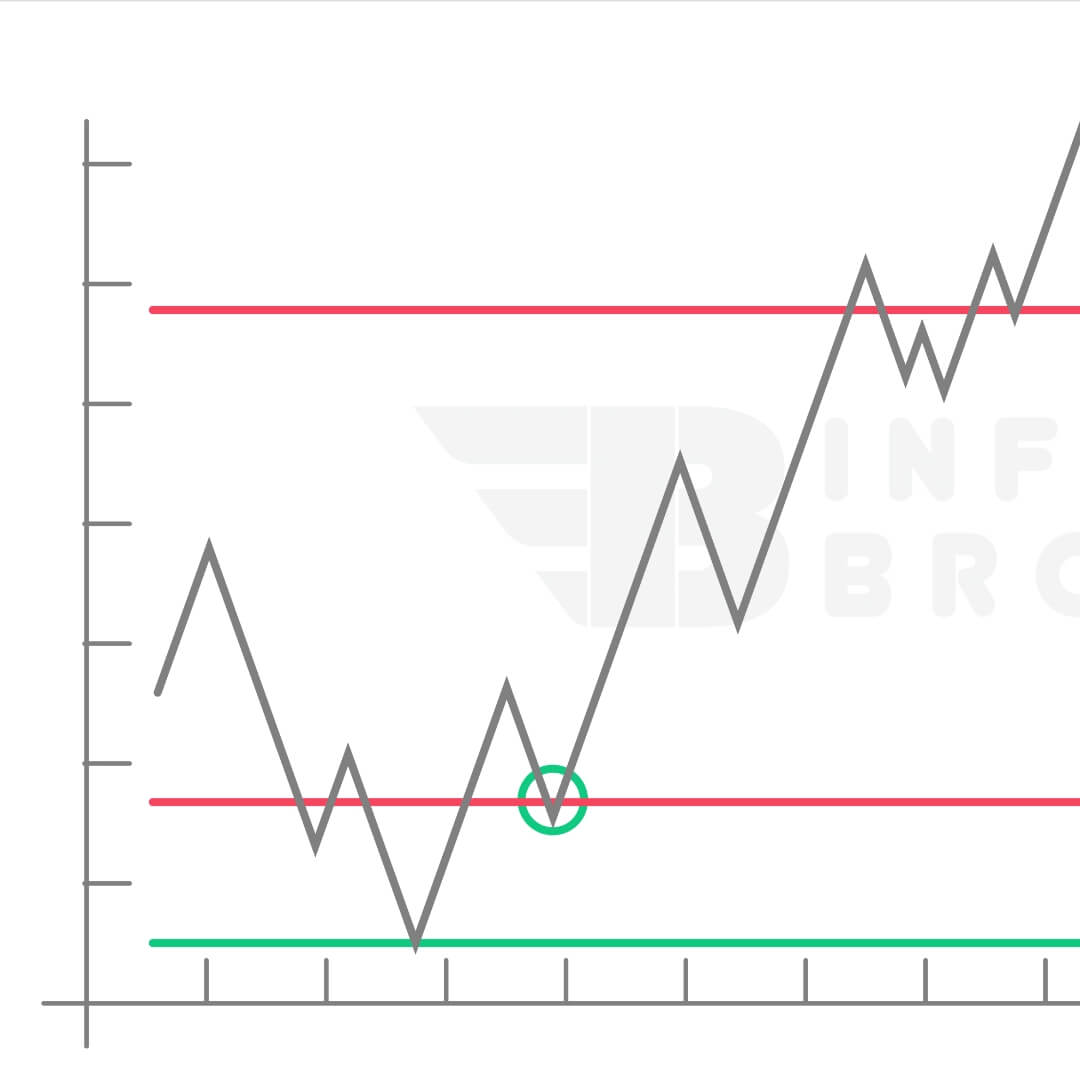
There is a simple approach to identify a market advantage in the graphic above. This configuration is feasible in most time frames. Here are the basic procedures for setting up a trade utilizing our edges to increase profits.
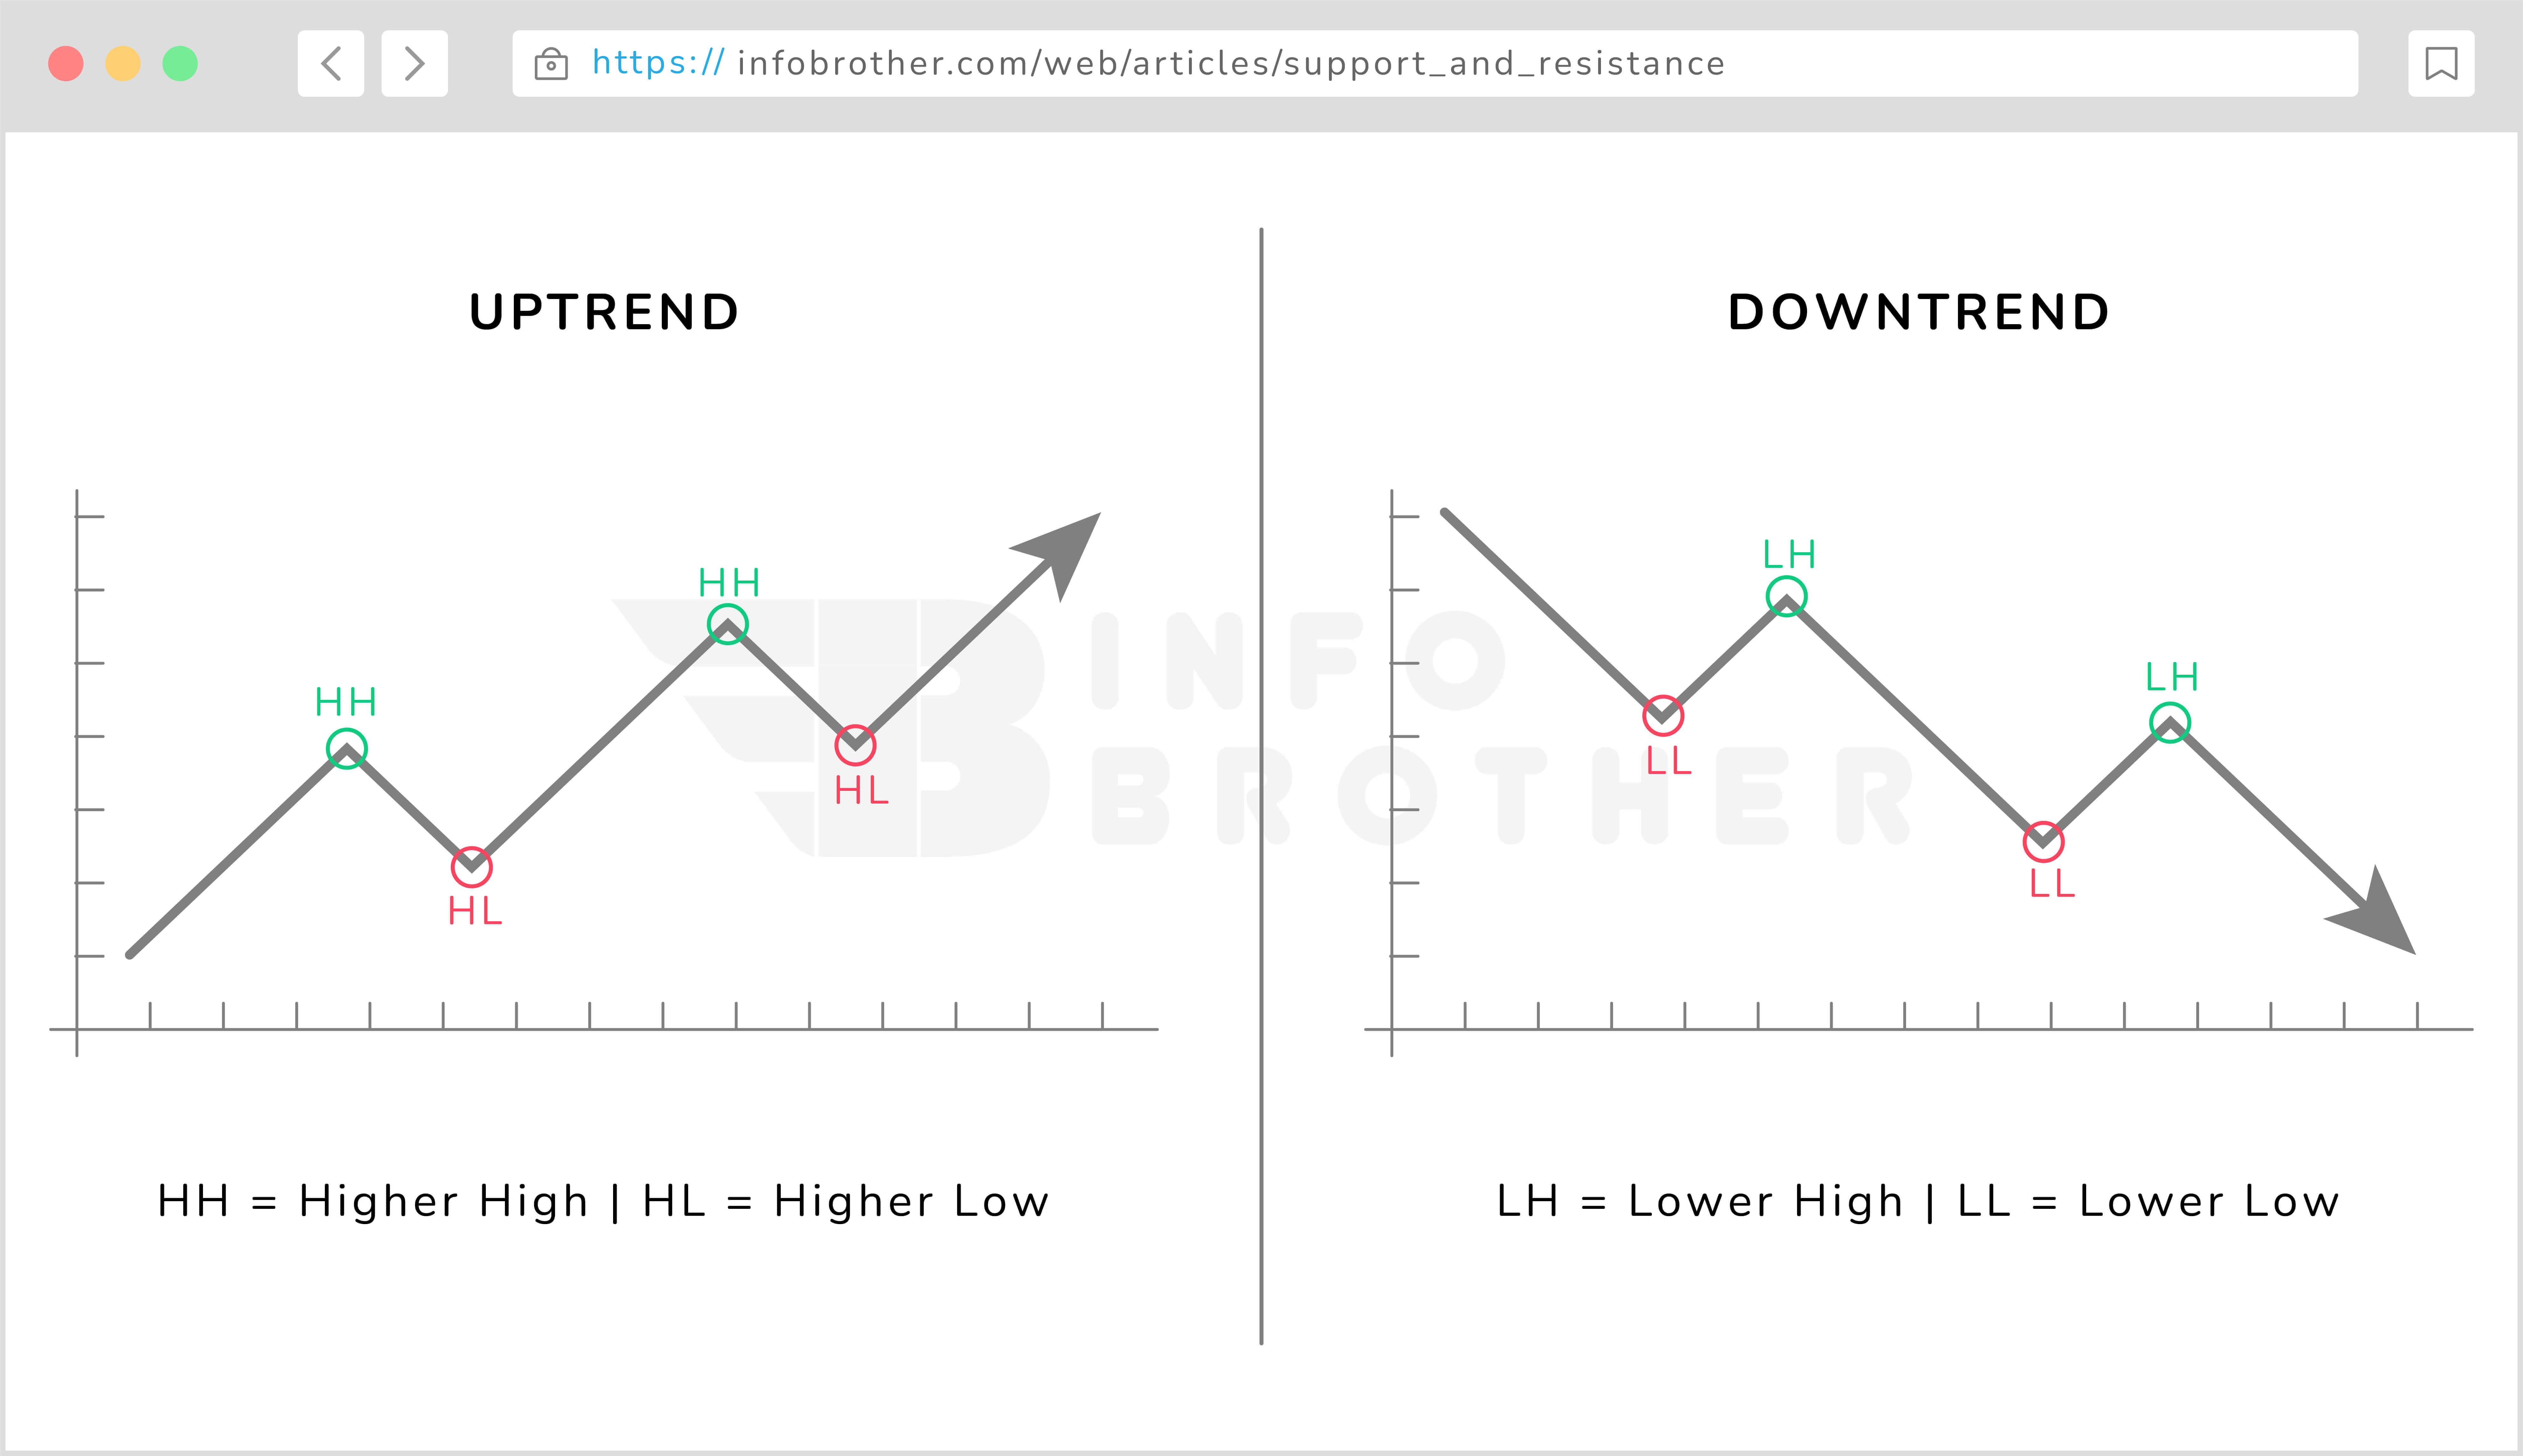
- Determine market structure: A bearish trend is defined by a succession of lower lows (LL) and lower highs (LH). The trend will be bullish if there is a succession of higher highs (HH) and higher lows (HL).
- Mark out key levels: Draw support and resistance levels. In a bearish trend, the prior support level will become the new resistance level.
- Examine the candlestick at key levels of support and resistance, then enter on the next momentum candle.