eBOOK/PDF
No ads? No problem! You can download our tutorials in a printable PDF format or as an EPUB file, optimized for your tablet or eReader.
Bearish Flag
How to Trade the Bearish Flag Pattern with 98% Accuracy.
Experienced traders have a wide range of methods at their disposal. The flag pattern, on the other hand, is one of the most popular and significant strategies. The flag patterns enable traders to engage in trending markets and comprehend price changes, as well as risk management measures to create low-risk entrances.
In this chapter, we'll look at what a bearish flag pattern is and how to spot one in a trending market. We'll also study trading tactics to make the bearish flag pattern more rewarding.
| Name: | Bearish Flag |
|---|---|
| Forecast: | Continuation Pattern |
| Trend prior to the pattern: | Downtrend |
| Opposite pattern: | Bullish Flag |
| Accuracy rate: | 98% |
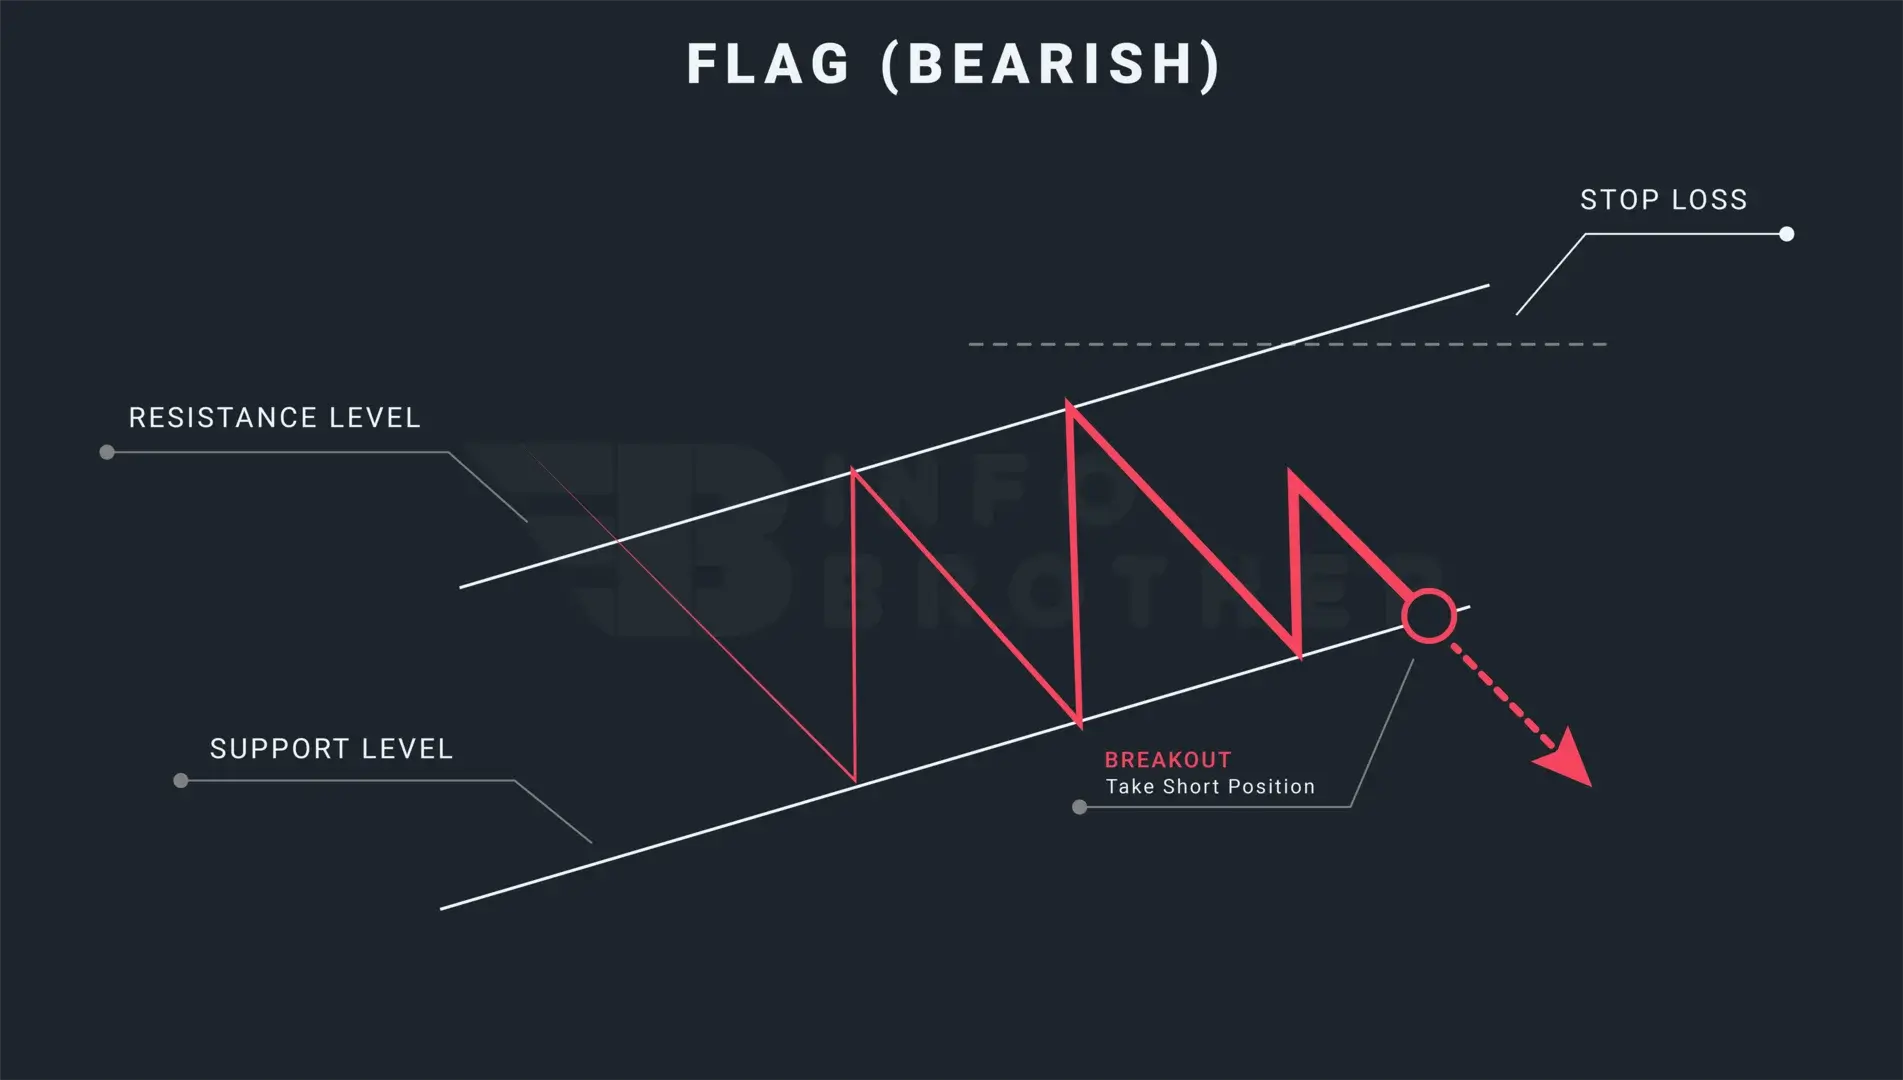
A bearish flag is a continuation pattern that appears in markets with significant downward trends and alerts traders to the likelihood of more declines in the trend. We called this arrangement a 'bearish flag' since it resembles a flag on a pole. The flag denotes a time of consolidation, but the pole denotes a dramatic vertical decline in the market. The flag can have a horizontal rectangular shape, but it can also have an angle-up shape that goes against the current trend.
The bears' flag patterns are appropriate for the current cryptocurrency market conditions because of the significant trends that seasoned investors may profit from. This pattern is effective for both swing trading and day trading. Trading with flag patterns is beneficial when the market has just broken out or is actively moving.
Most traders confuse flag patterns with pennant patterns. However, these two designs are diametrically opposed. The fundamental contrast between the flag pattern and the pennant pattern is the appearance of support and resistance levels inside the formations. Flag patterns are made up of two parallel lines, whereas pennant patterns are made up of support and resistance lines that converge on an apex.
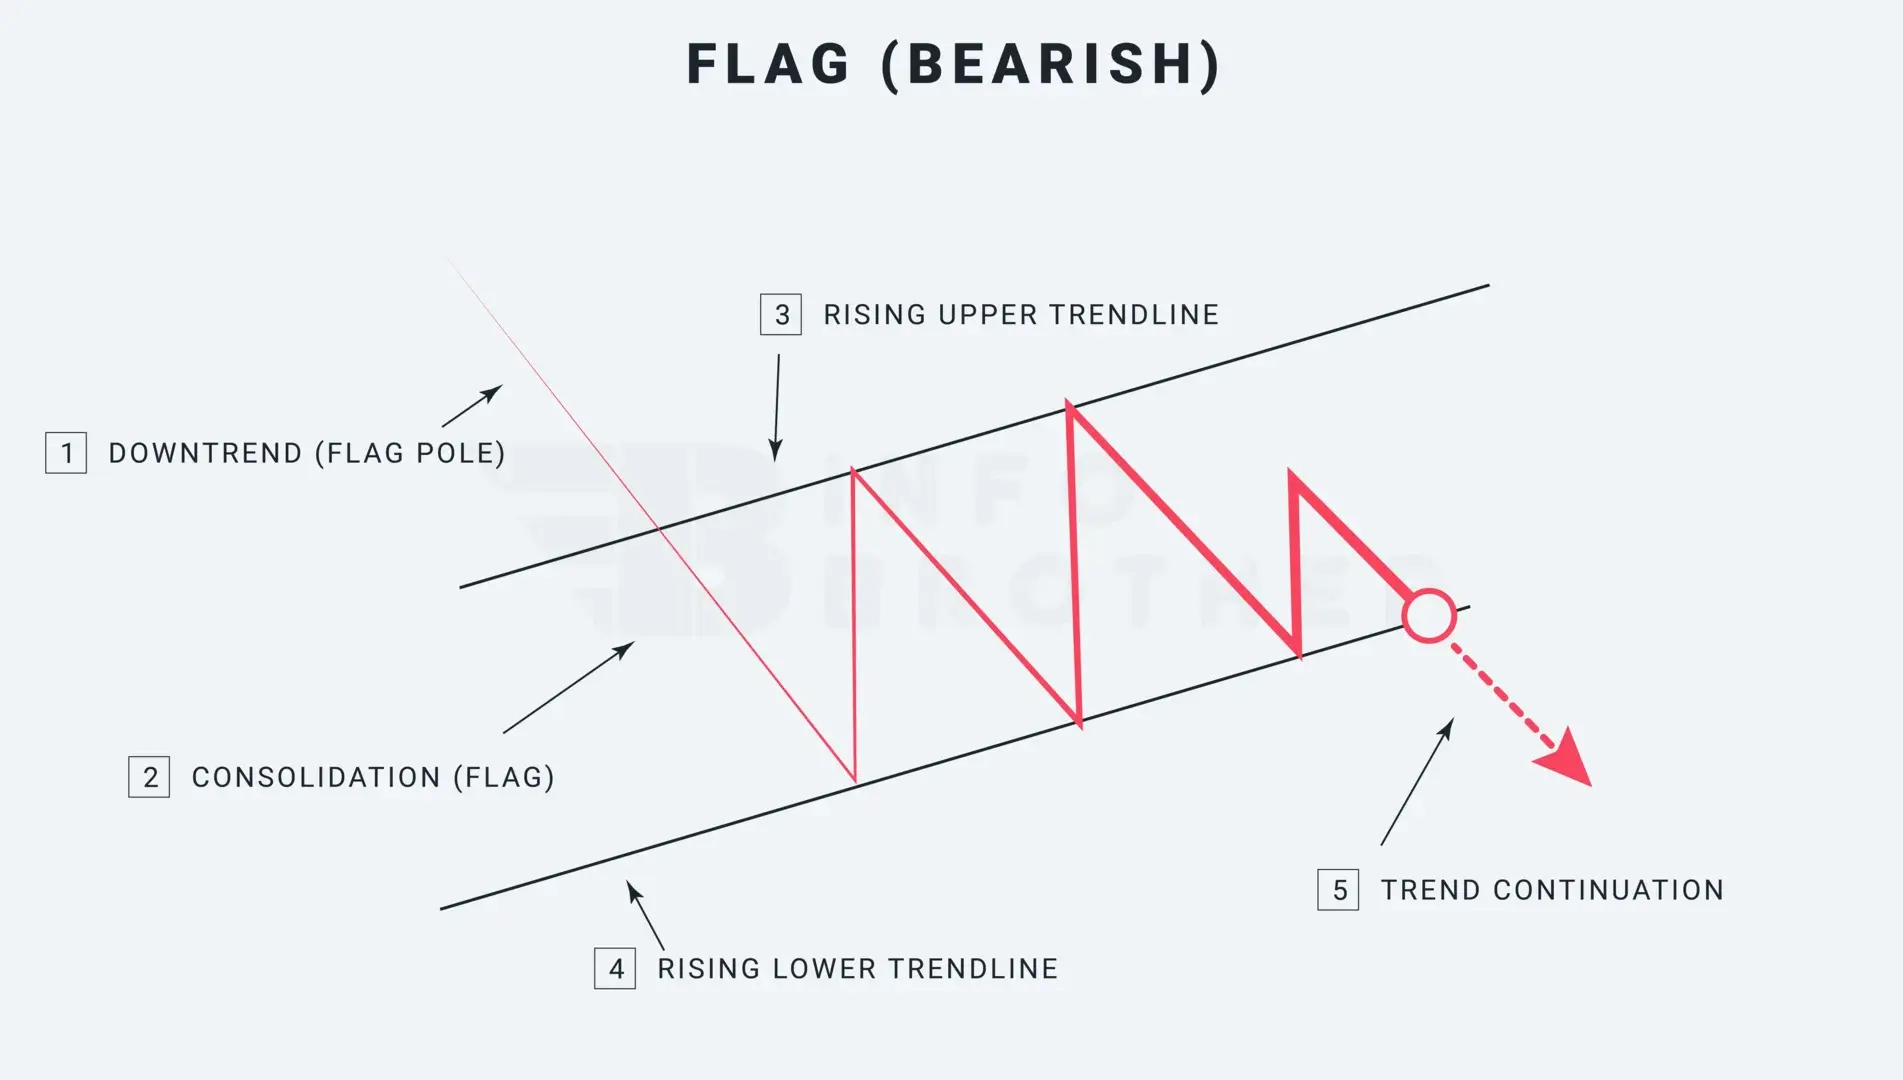
The bear flag pattern is a chart pattern that indicates the continuation of a decline. Price movement consolidates inside two parallel lines in the opposite direction of the downward trend before breaking out and continuing the decline. If this pattern occurs during a downtrend, the trend has a 98% likelihood of continuing.
There are five factors to examine while determining a bearish flag pattern.
1. Downtrend (Flagpole)
The market must be in a downward trend prior to the development of the bearish flag pattern. Unlike other designs, such as the symmetrical triangle, this one always starts with a flagpole. If the trend is upward or sideways, traders should avoid this pattern.
What is the flag?
A "flag" is a term used in technical analysis. It is a pattern that develops anytime there is a strong gain or decline, followed by trading inside a small price range, and then it is finished off by another sharp rise or decline.
2.Consolidation Phase (Flag)
The market is rapidly declining before entering a phase of consolidation. Following this time of consolidation, the market will have another large downward trend to complete the pattern.
3. Rising upper trendine (resistance level)
Link the highs to draw the rising trend line or resistance level throughout the consolidation period. We need at least two swing highs to create the upper trendline or resistance level. More trendline connections, on the other hand, produce more consistent trading results.
4. Rising lower trendline (support level)
Link the lows to construct another rising trend line or support level throughout the consolidation period. We need at least two swing lows to create the bottom trendline or support level. More trendline connections, on the other hand, produce more consistent trading results.
Note that the support and resistance levels, or upper and lower trendlines, inside the formations of bearish flag patterns are two parallel lines running in the opposite direction of the downtrend.
5. Continuation of a Trend
In the case of a bearish flag pattern, the previous downward trend has resumed following the breakout when the price falls below the support level. The candle that emerges from the bearish flag formation should do so with strong volume and speed. The support line is frequently breached by bearish engulfing candles.
Flag pattern trendlines must have a minimum of two swing highs and two swing lows. More trendline interactions, on the other hand, result in more consistent trading outcomes.
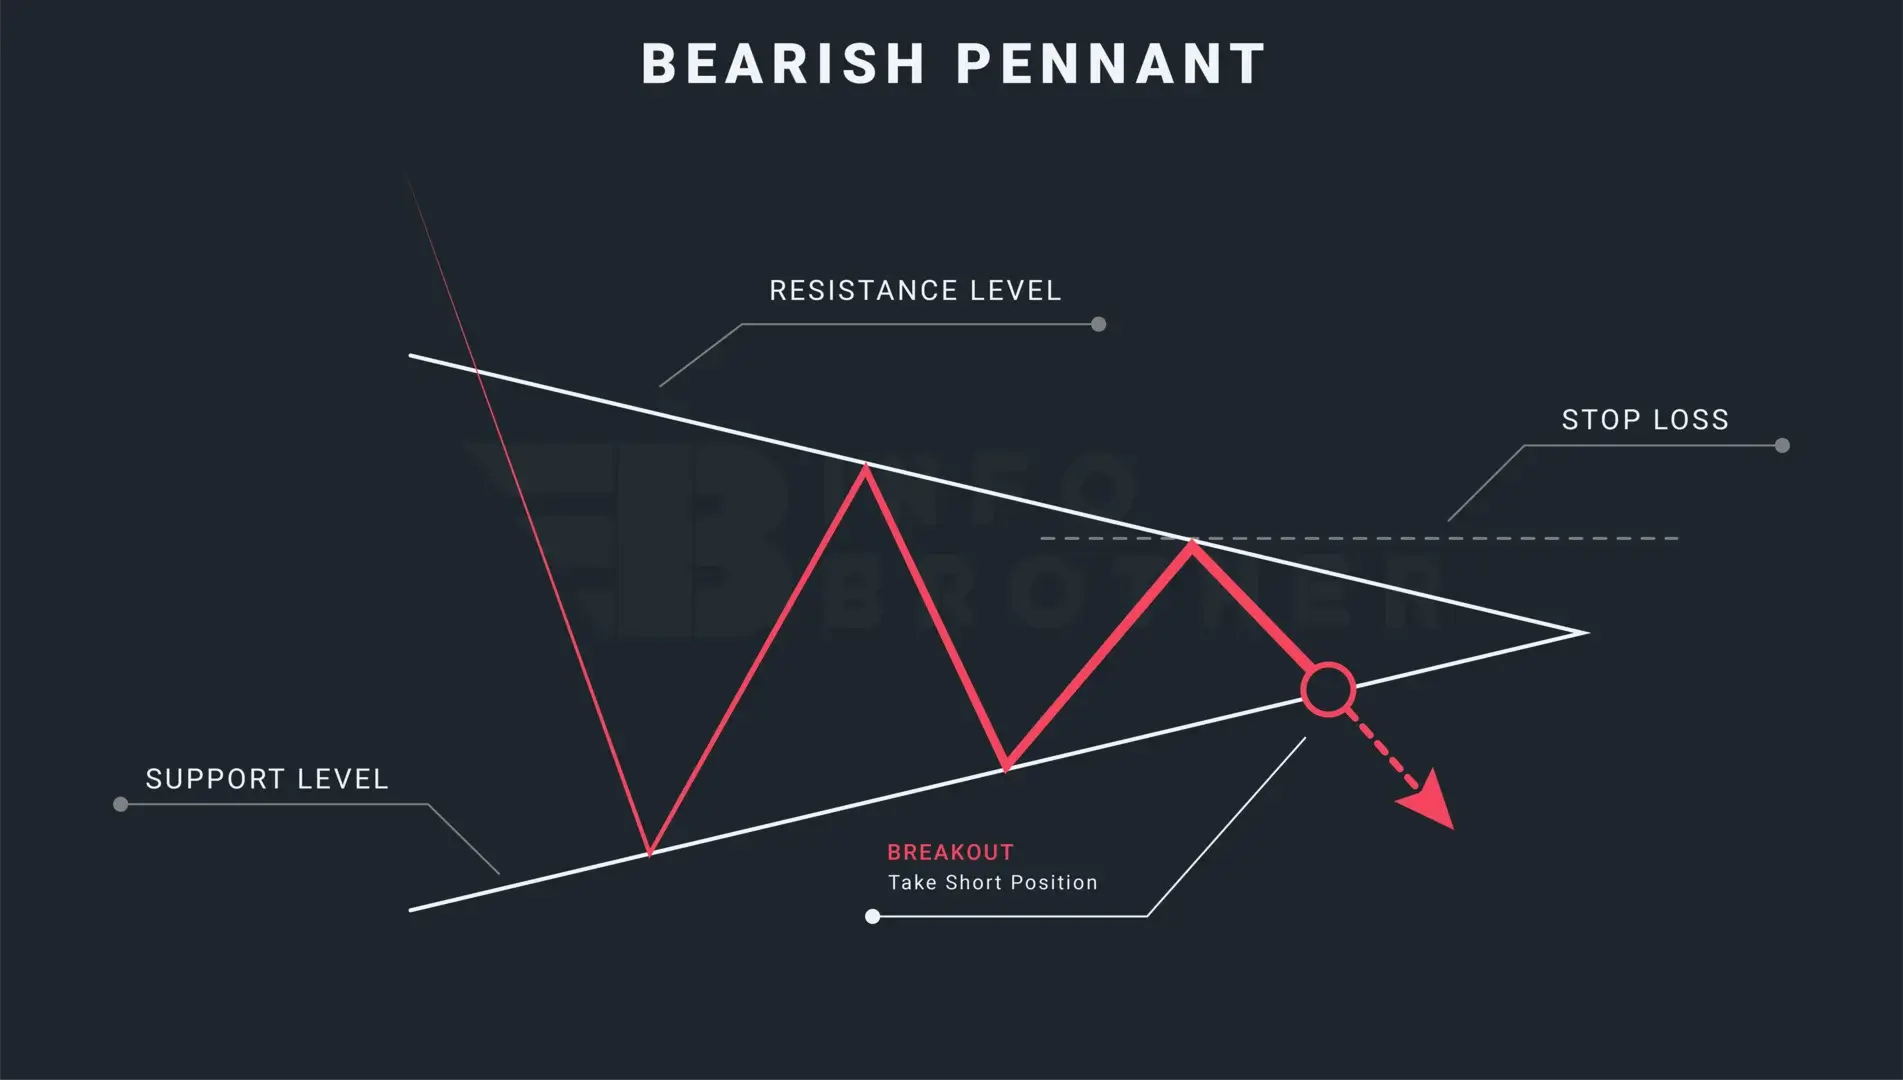
The Difference Between a Flag Pattern and a Pennant Pattern:
The look of the support and resistance levels inside the formations is the primary distinction between a flag pattern and a pennant pattern.
Read More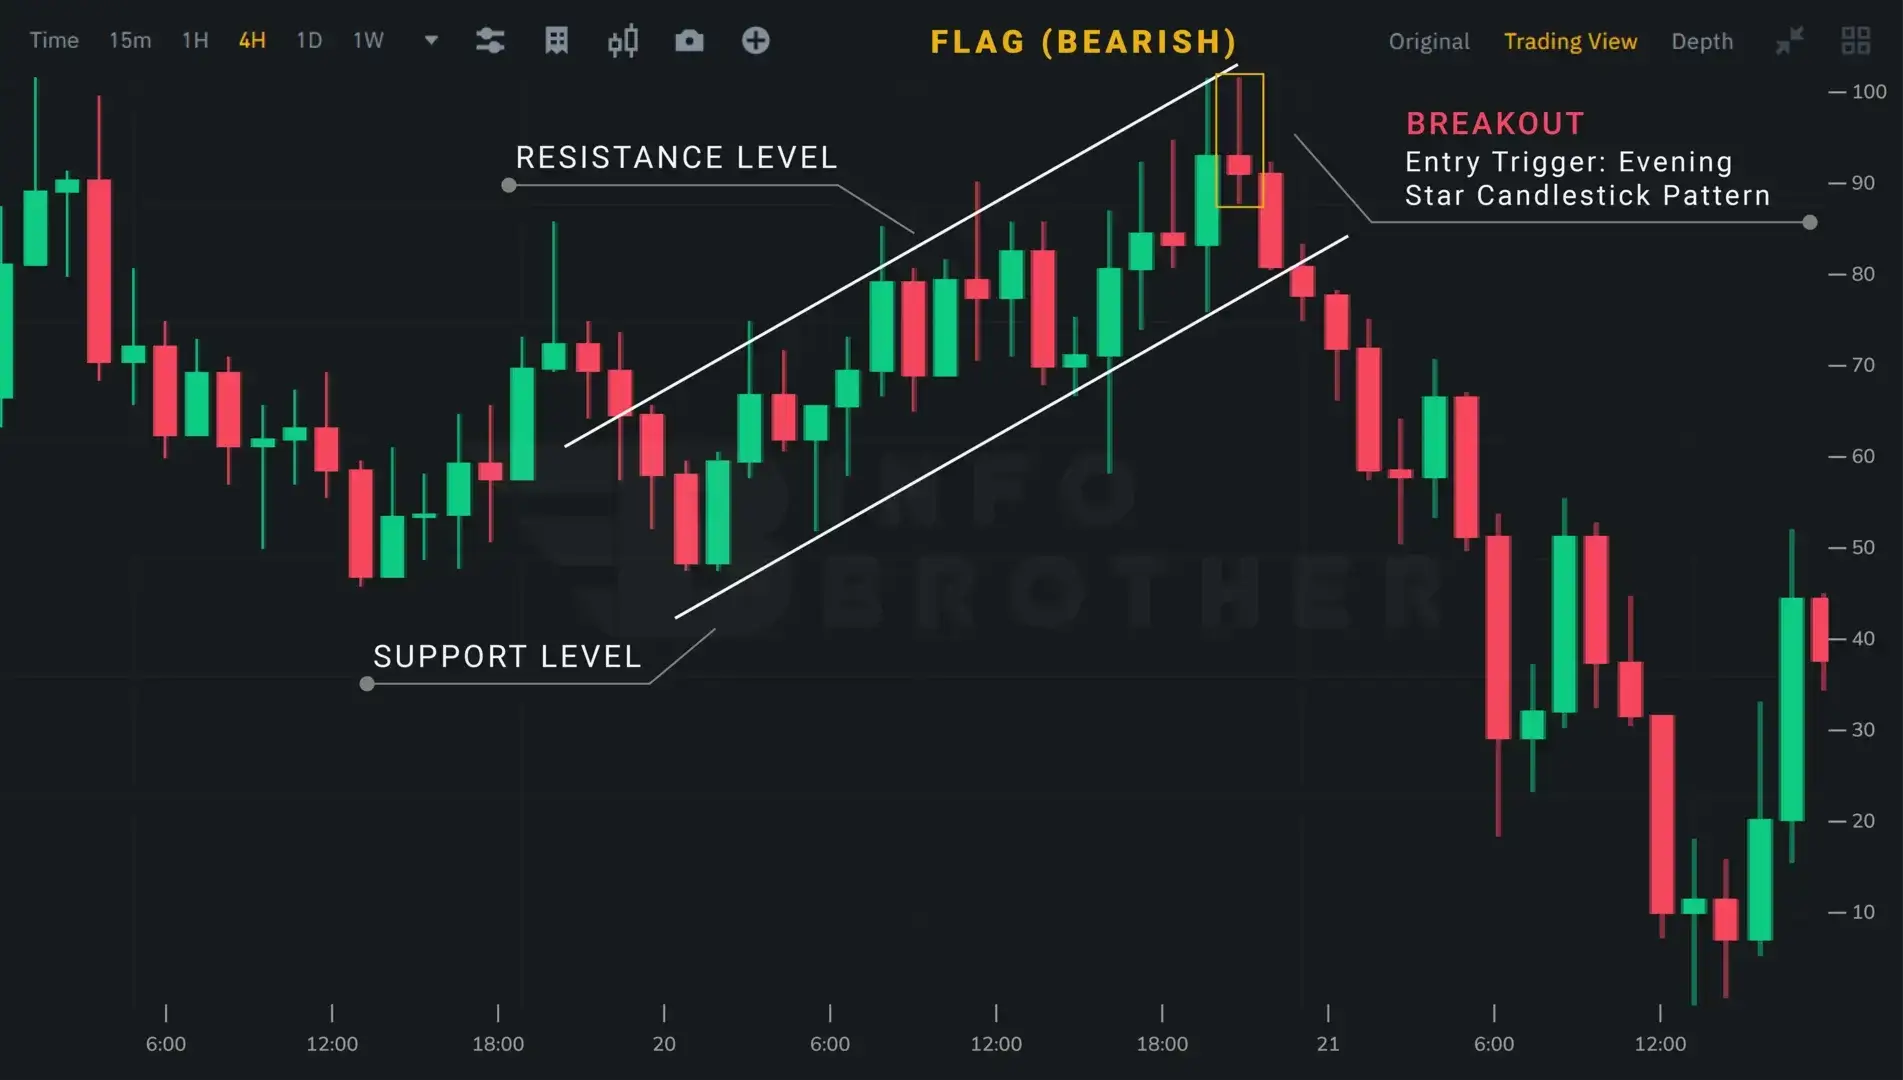
Trading the bear flag pattern is a straightforward operation if the previous step, recognizing and drawing the formation, is completed correctly. Downtrends are shaped and formed by the bear flag, which allows traders to pinpoint entry and limit levels.
Traders enter at the close of the breakout candle or wait for a retest, which can be challenging because the price movement may never return to retest the broken resistance.
Any movement to the interior body of the flag invalidates the pattern. In very volatile markets, we should follow the risk management rule and place the stop-loss precisely above the flag formation to avoid false breakouts and market whipping.
Traders just copy and paste the flagpole from the point when the breakout happened in the case of a take-profit. The end point of the prior trendline shows a place where we might consider taking profits. At this point, we can see that the market hit this level and then slightly corrected lower, suggesting that the bear flag's take profit order has been met.
Remember that market fluctuations aren't always predictable, so risk management methods should always be adopted before starting a trade. False breakouts may be a significant issue with these patterns. Price may deviate from the pattern only to re-enter it, or it may break out in the other direction. A trader can prevent this by waiting for the retest.
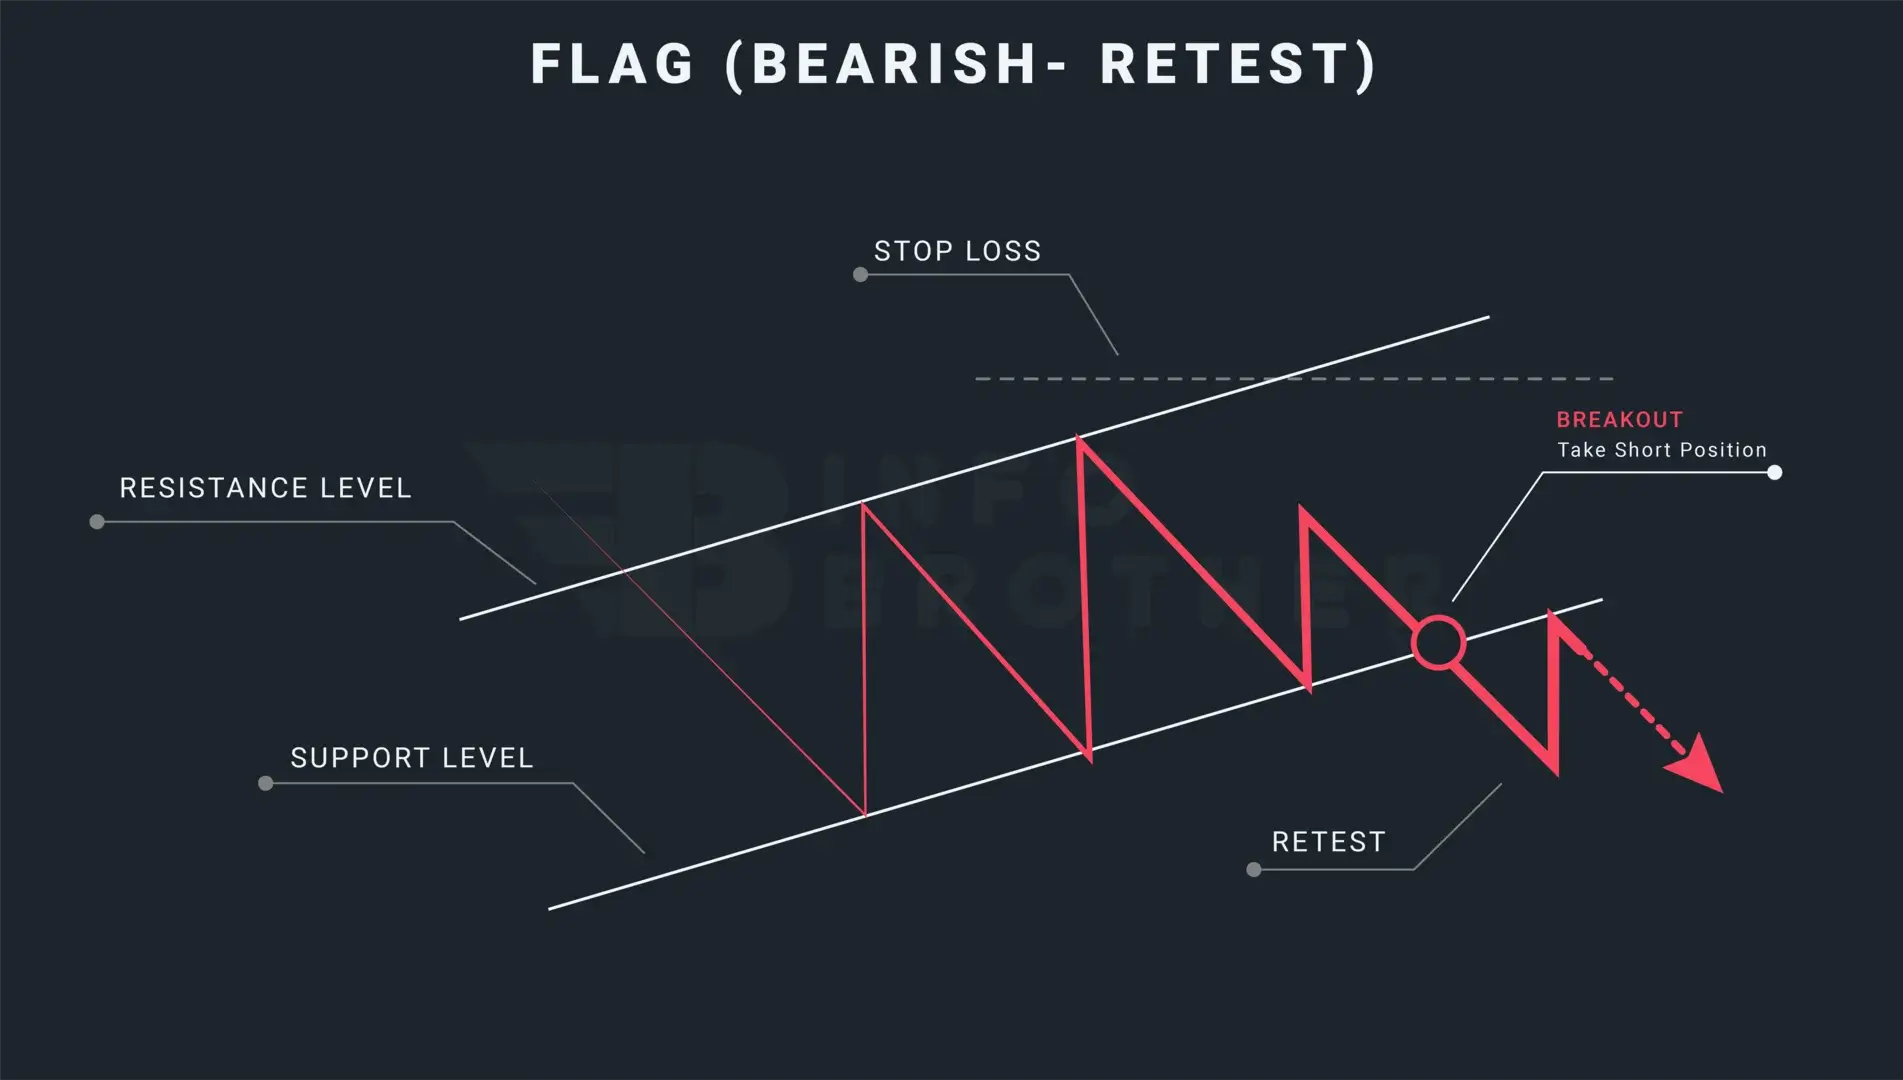
The process of the price returning to the level that the market previously broke is known as retesting. To avoid false breakouts, traders might wait for a retest, which occurs when the price breaks through the trendline and returns to retest the just passed resistance.

Sardar Omar
I did my hardest to present you with all of the information you need on this subject in a simple and understandable manner. However, if you have any difficulties understanding this concept or have any questions, please do not hesitate to ask. I'll try my best to meet your requirements.
Disclaimer:This material is provided purely for educational purpose and is not intended to provide financial advice.
