eBOOK/PDF
No ads? No problem! You can download our tutorials in a printable PDF format or as an EPUB file, optimized for your tablet or eReader.
Bullish Pennant Pattern
Master the Bullish Pennant Pattern: Key Trading Tactics for Continuation.
Pennant patterns are market continuation patterns that are utilized by traders to forecast future market moves. The pennant pattern, like the triangle pattern, has several significant factors to remember when trading.
In this chapter, we'll study what a bullish pennant pattern is and how to spot one in a chart. We'll go through how to use this pattern to make better deals.
| Name: | Bullish Pennant |
|---|---|
| Forecast: | Continuation Pattern |
| Trend prior to the pattern: | Uptrend |
| Opposite pattern: | Bearish Pennant |
| Accuracy rate: | 84% |

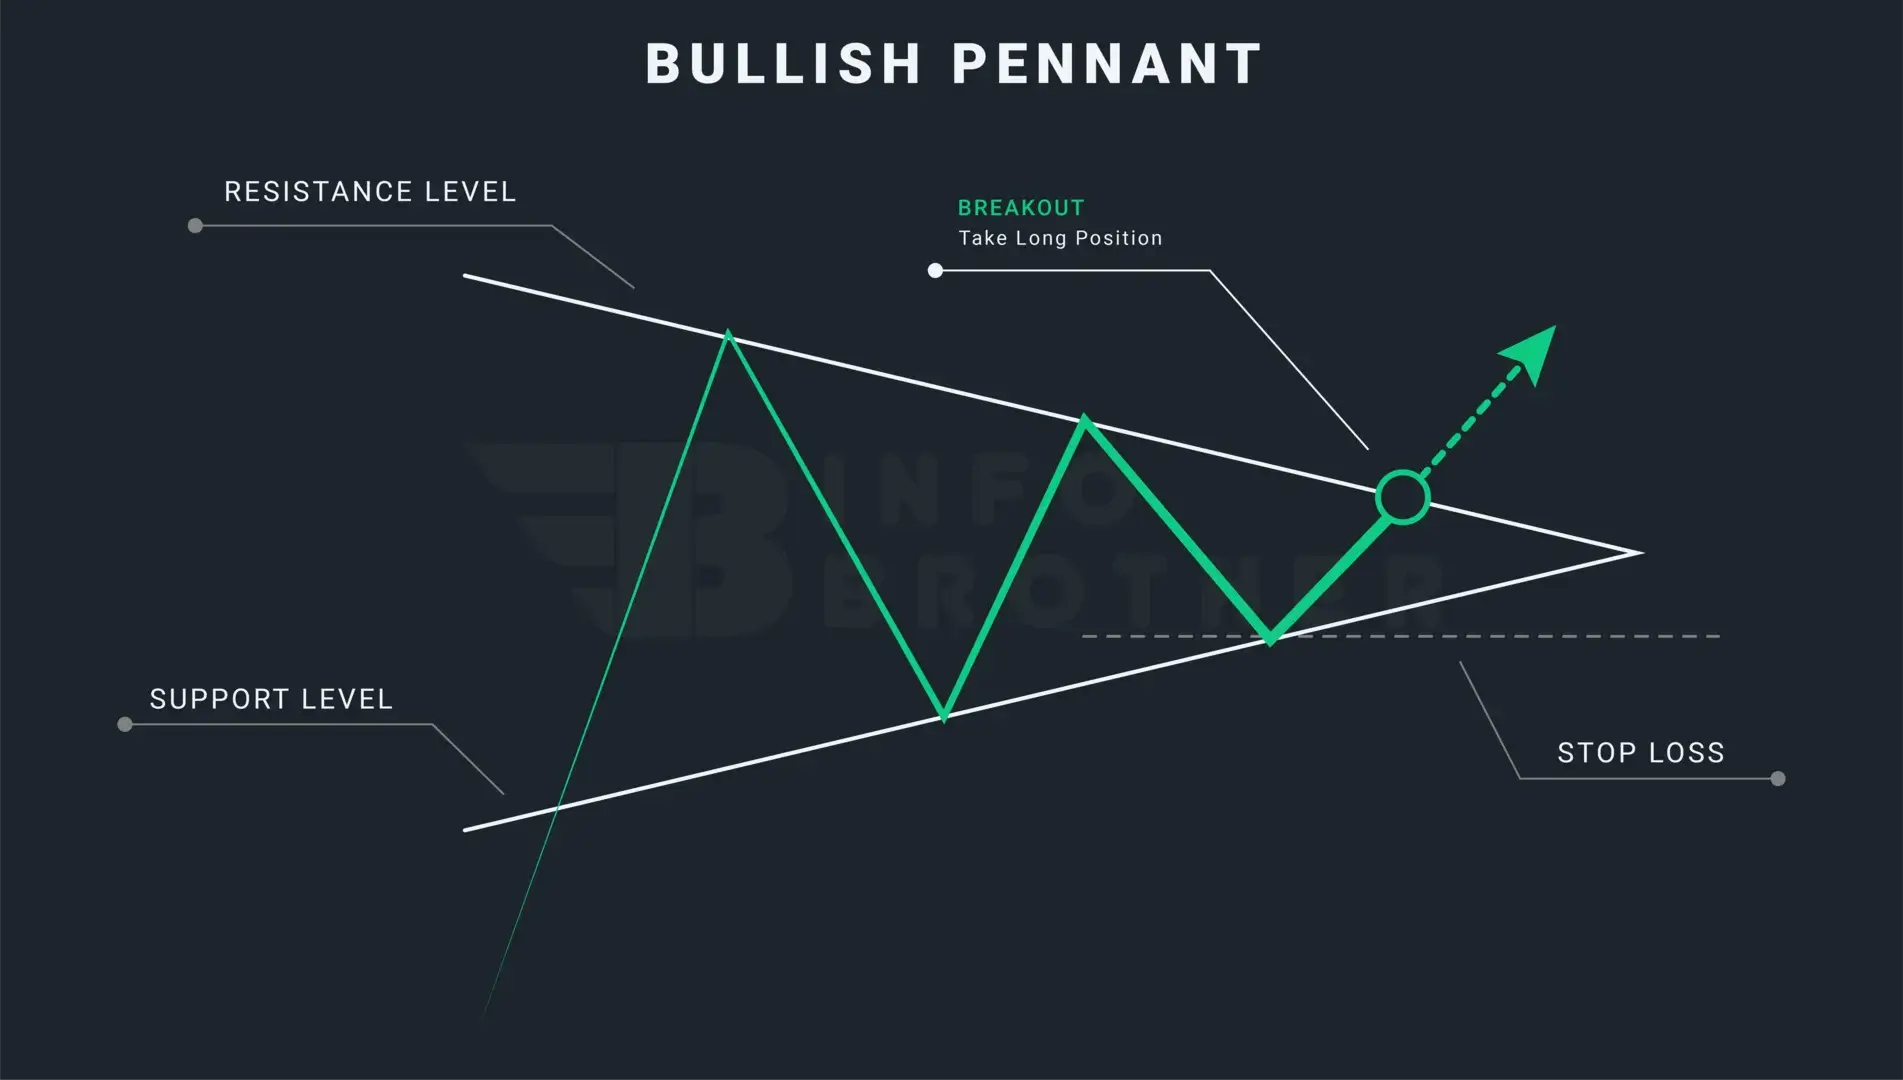
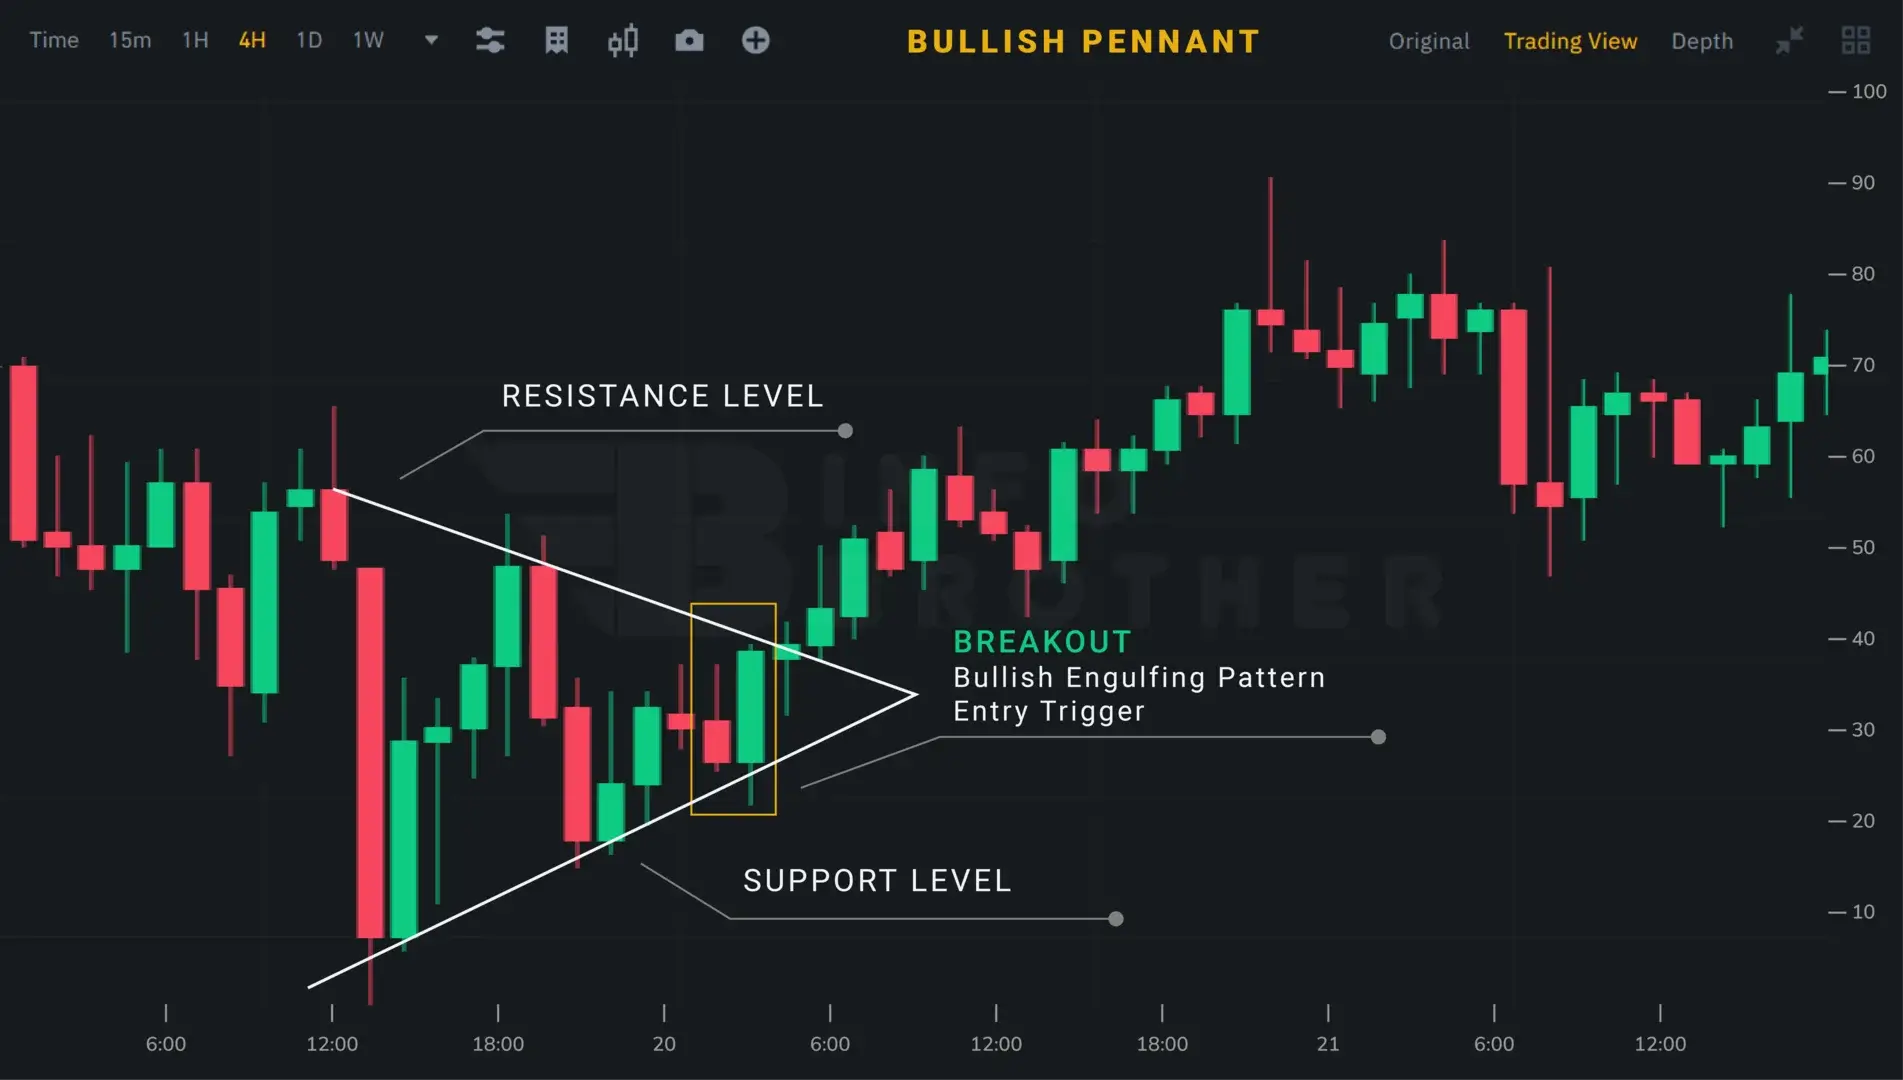
The continuation chart pattern known as a "bullish pennant" frequently occurs before a price movement in the direction of the preceding trend. This pattern is visible to traders when there is a significant upward trend in the market, followed by a temporary consolidation. The pennant design resembles a little symmetrical triangle constructed of a lot of candlesticks.
Depending on the possible future price movement after the breakout from the structure, pennants can be bullish or bearish in nature.
Because they offer a good risk-reward ratio when handled correctly, pennant patterns are regarded by experienced traders as the most trustworthy chart-based trading patterns. The pennant patterns, on the other hand, are fractal in nature, which means that they may appear at all lengths of trend, from the smallest to the longest. They can also develop in any openly traded, liquid market.
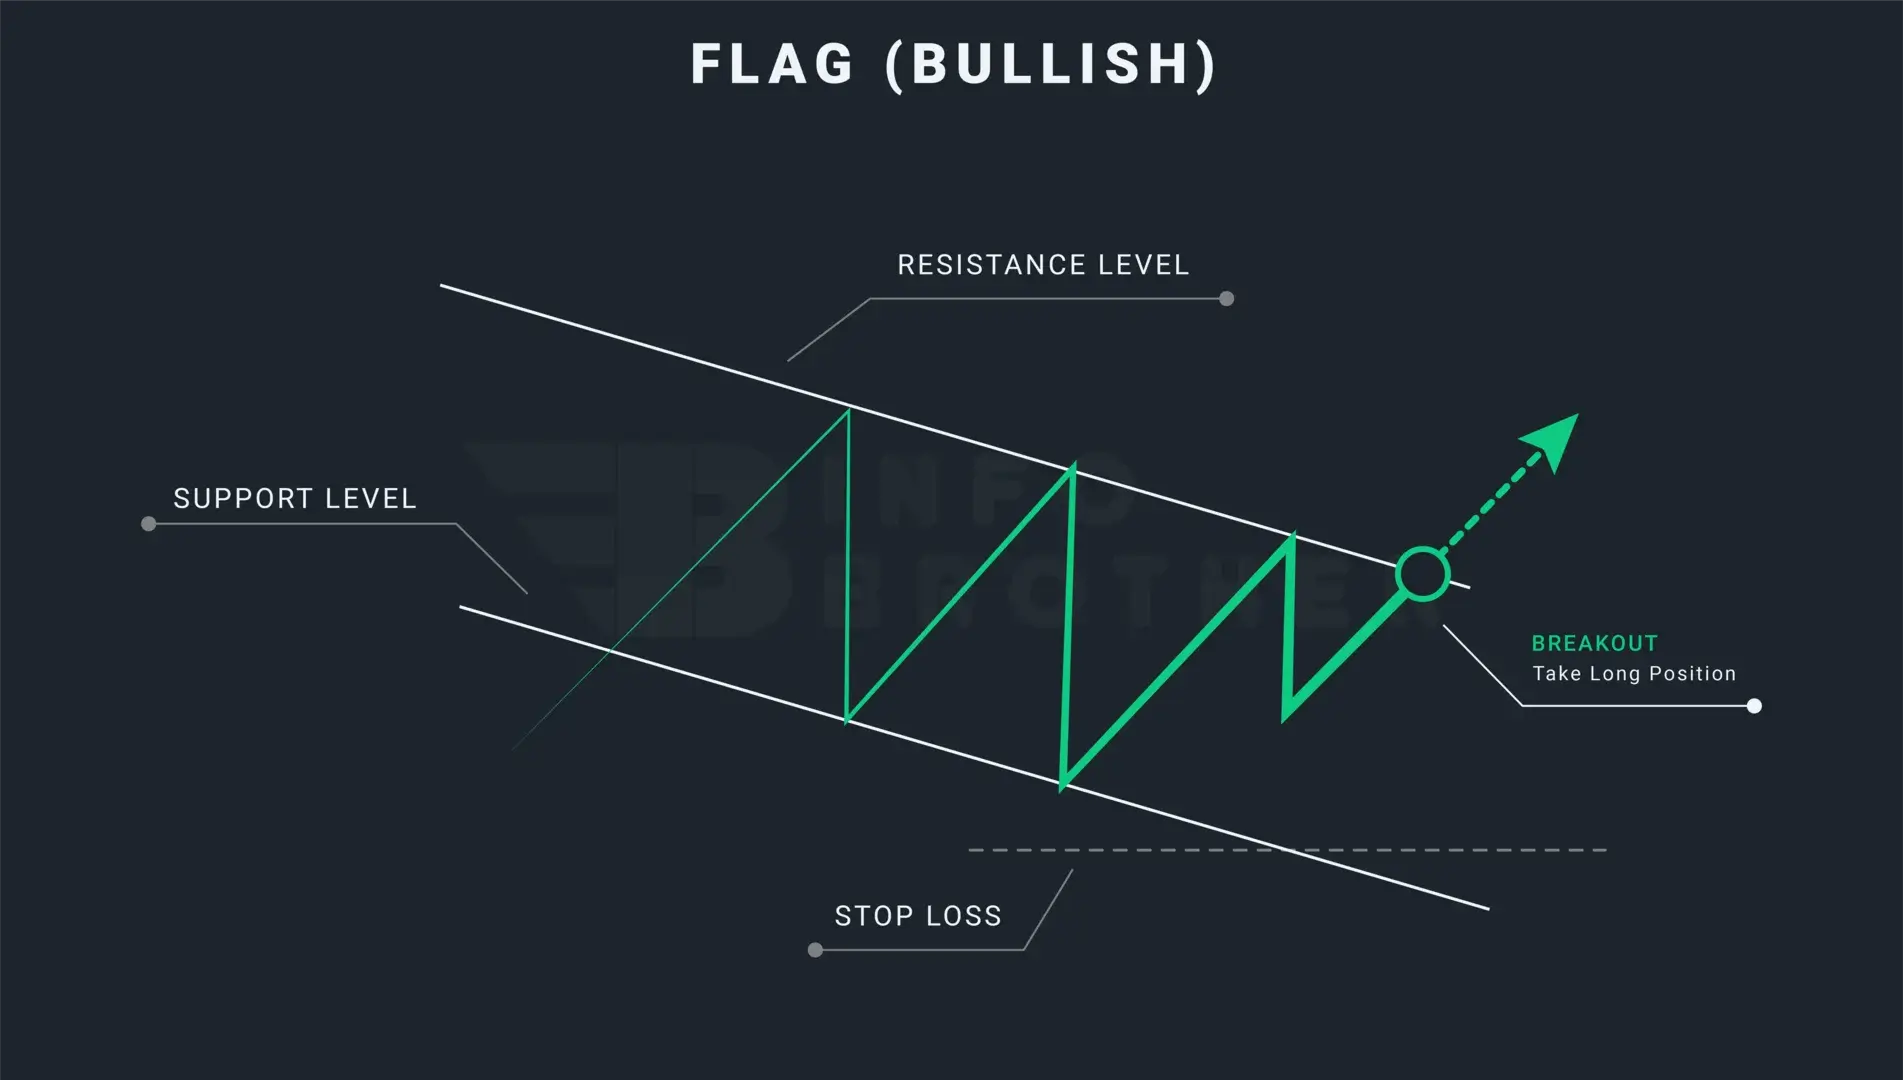
The majority of traders equate flag patterns to pennant patterns. However, these two designs couldn't be more unlike one another. The appearance of the support and resistance levels inside the formations is the primary distinction between the flag pattern and the pennant pattern. Flag patterns consist of two parallel lines, whereas pennant patterns have support and resistance lines that converge towards an apex.

The pennant pattern seems to be a small symmetrical triangle with converging trendlines enclosing the price movement. Traders should pay attention to this pattern due to its high accuracy rate. If this pattern appears during an upward trend, there is an 84% chance that the trend will continue.
A few crucial factors to think about while attempting to identify a bullish pennant pattern are stated below.
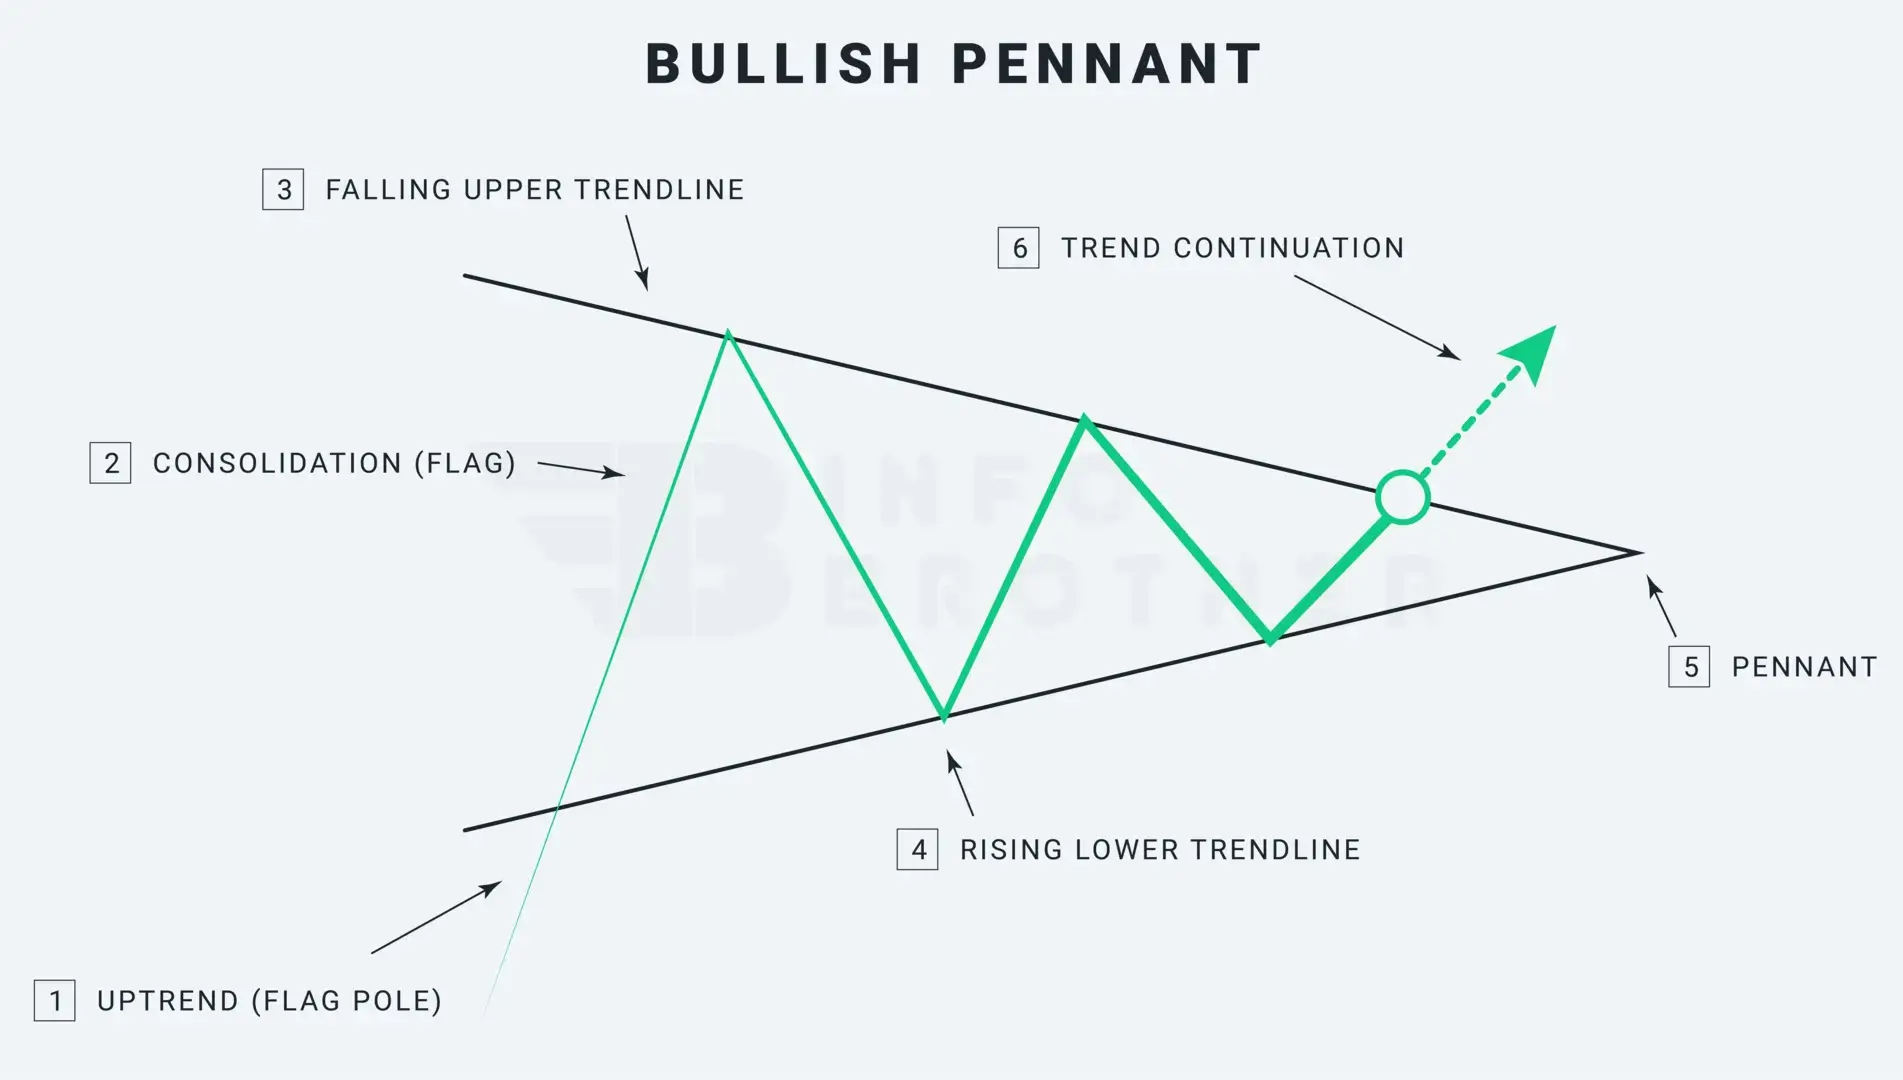
1. upward trend (Flagpole)
The market must be in an upward trend prior to the formation of the bullish pennant pattern. This design differs from others, such as the symmetrical triangle, in that it always begins with a flagpole. If the trend is downward or sideways, traders should avoid trading this pattern. The symmetrical triangle is preceded by the initial strong movement, the flagpole.
What is the flag?
A "flag" is a term used in technical analysis. It is a pattern that develops anytime there is a strong gain or decline, followed by trading inside a small price range, and then it is finished off by another sharp rise or decline.
2. Consolidation
The market is rising sharply before entering a period of consolidation. The market will see a brief period of stabilization before witnessing another strong jump to complete the pattern.
3. A falling upper trendline
During the consolidation period, link the highs to draw the trend line or resistance level. To build the upper trendline or resistance level, we need at least two swing highs. More trendline contacts, on the other hand, result in more dependable trading outcomes.
4. Rising lower trendline
When the market is consolidating, link the lows to construct another rising lower trendline or support level. To draw trendlines or a support level, we need at least two swing lows. However, more trendline interactions provide trading results that are more dependable.
5. The Pennant
A pennant is a little symmetrical triangle that, like a cone, starts large and narrows as the pattern progresses. An upper falling trendline and a lower rising trendline are drawn to produce a pennant shape.
What exactly is a symmetrical triangle?
A symmetrical triangle is a chart pattern formed by two converging trendlines, with the top trendline or resistance level decreasing and the lower trendline or support level increasing. Although the previous trend is generally continued, this pattern shows an even balance between buyers and sellers.
6. Continuing the trend
In the case of a bullish pennant, the previous uptrend resumed following the breakout when the price broke above the resistance level. The candle that emerges from the pennant design should do so with great volume and at a rapid rate.Bullish Marubozu candles that breach the resistance line are typically found.
The trendlines of the pennant patterns must have a minimum of two swing highs and two swing lows. However, more trendline interactions lead to more reliable trading outcomes.

The Difference Between a Flag Pattern and a Pennant Pattern:
The look of the support and resistance levels inside the formations is the primary distinction between a flag pattern and a pennant pattern.
Read More
Traders should wait for the breakout before entering a trade after a rapid and dramatic price movement. The pennant pattern forecasts that following the quick price movement, there will most likely be a breakout and continuation in the direction of the original move.
Given the magnitude of the move, a stop-loss can be put at the low of the breakout candle; alternatively, for more cautious traders, a stop-loss can be set below the pennant to decrease downside risk. This frequently offers traders with ample security.
Keep in mind that market movements aren't always what we anticipate, so risk management strategies should always be implemented before entering a trade.
False breakouts might be a major problem with these patterns. Price may veer from the pattern just to re-enter it, or it may even break out in the other direction. Waiting for the retest will help a trader avoid this.
What exactly is a retest?
The process of the price returning to the level that the market previously broke is known as retesting. To avoid false breakouts, traders might wait for a retest, which occurs when the price breaks through the trendline and returns to retest the just passed resistance.

Sardar Omar
I did my hardest to present you with all of the information you need on this subject in a simple and understandable manner. However, if you have any difficulties understanding this concept or have any questions, please do not hesitate to ask. I'll try my best to meet your requirements.
Disclaimer:This material is provided purely for educational purpose and is not intended to provide financial advice.
