eBOOK/PDF
No ads? No problem! You can download our tutorials in a printable PDF format or as an EPUB file, optimized for your tablet or eReader.
Falling Wedge
How to Trade the Falling Wedge: Master Bullish Continuation Patterns.
Wedge patterns are chart patterns that resemble symmetrical triangle patterns in that trading occurs across an initially large price range before narrowing as trading proceeds. Although wedge patterns can be a reversal signals, they differ from symmetrical triangles in that they have a significant bias towards being either bullish for falling wedges or bearish for rising wedges.
In this chapter, we will delve deep into the Falling Wedge pattern, exploring its formation, key characteristics, and how it serves as a reliable indicator for predicting a bullish reversal in the market.
| Name: | Falling Wedge |
|---|---|
| Forecast: | continuation Pattern |
| Trend prior to the pattern: | Uptrend |
| Opposite pattern: | Rising Wedge |
| Accuracy rate: | 92% |
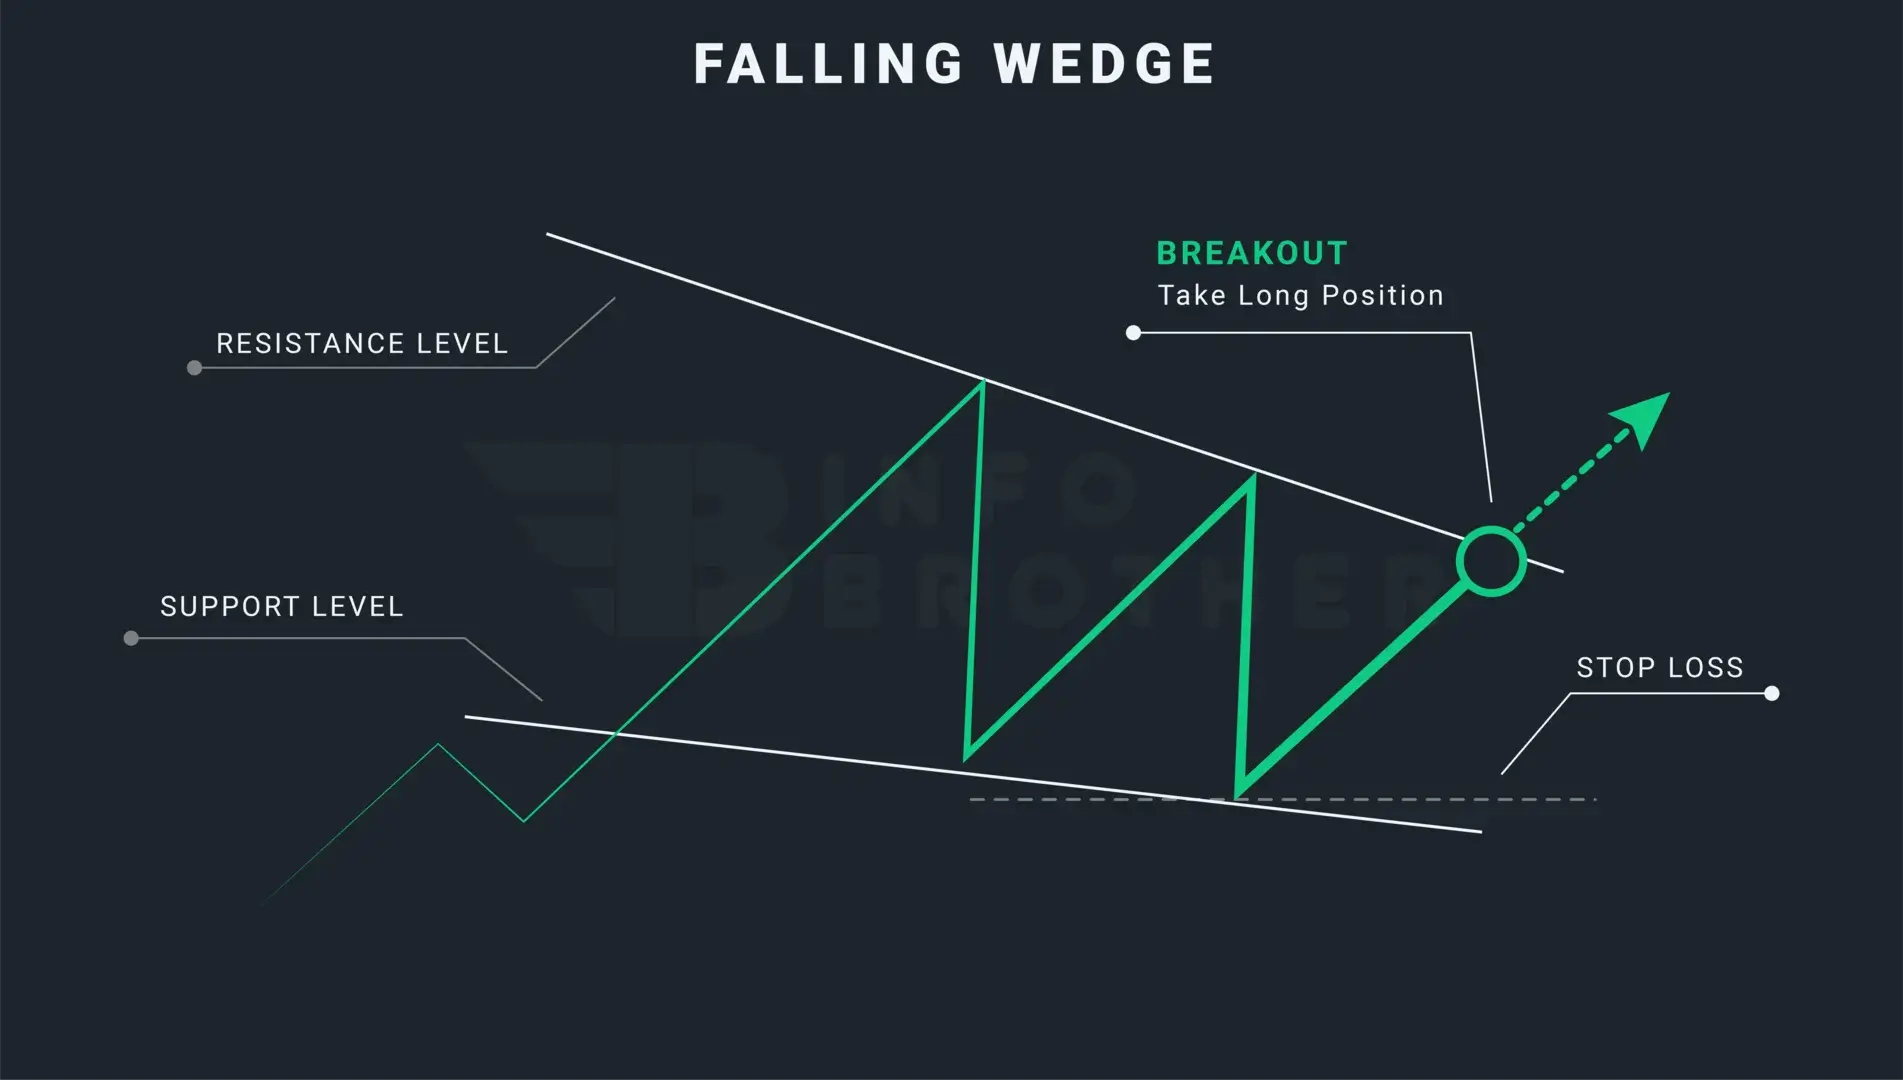
The falling wedge also known as descending wedge is a bullish continuation pattern that looks like a wedge because it starts out broad at the top and gets smaller as prices decline. In contrast to symmetrical triangles, which have no slope, the price action produces a cone with lower highs and lower lows that slopes downward.
Prior to the price action correcting lower, while the price is moving in a broad bullish trend, the falling wedge pattern will appear. Two convergent trend lines that act as both support and resistance are drawn within this pullback. When the price breaches the top line or resistance level, the consolidation phase is over.
One of the most important characteristics of the falling wedge pattern is the volume, which falls as the channel converges. The buyers are then able to tip the scales in their favour and drive the price action higher after the consolidation of the momentum within the channel.
Falling Wedge Pattern in a Downtrend:
We will classify the falling wedge pattern as a reversal pattern if it emerges in a downward trend. This pattern appears when the price forms two contracting lines with lower highs and lower lows. If a falling wedge is discovered in a market that is trending downwards, traders view this pattern as a bullish reversal signal and search for prospective purchasing opportunities.
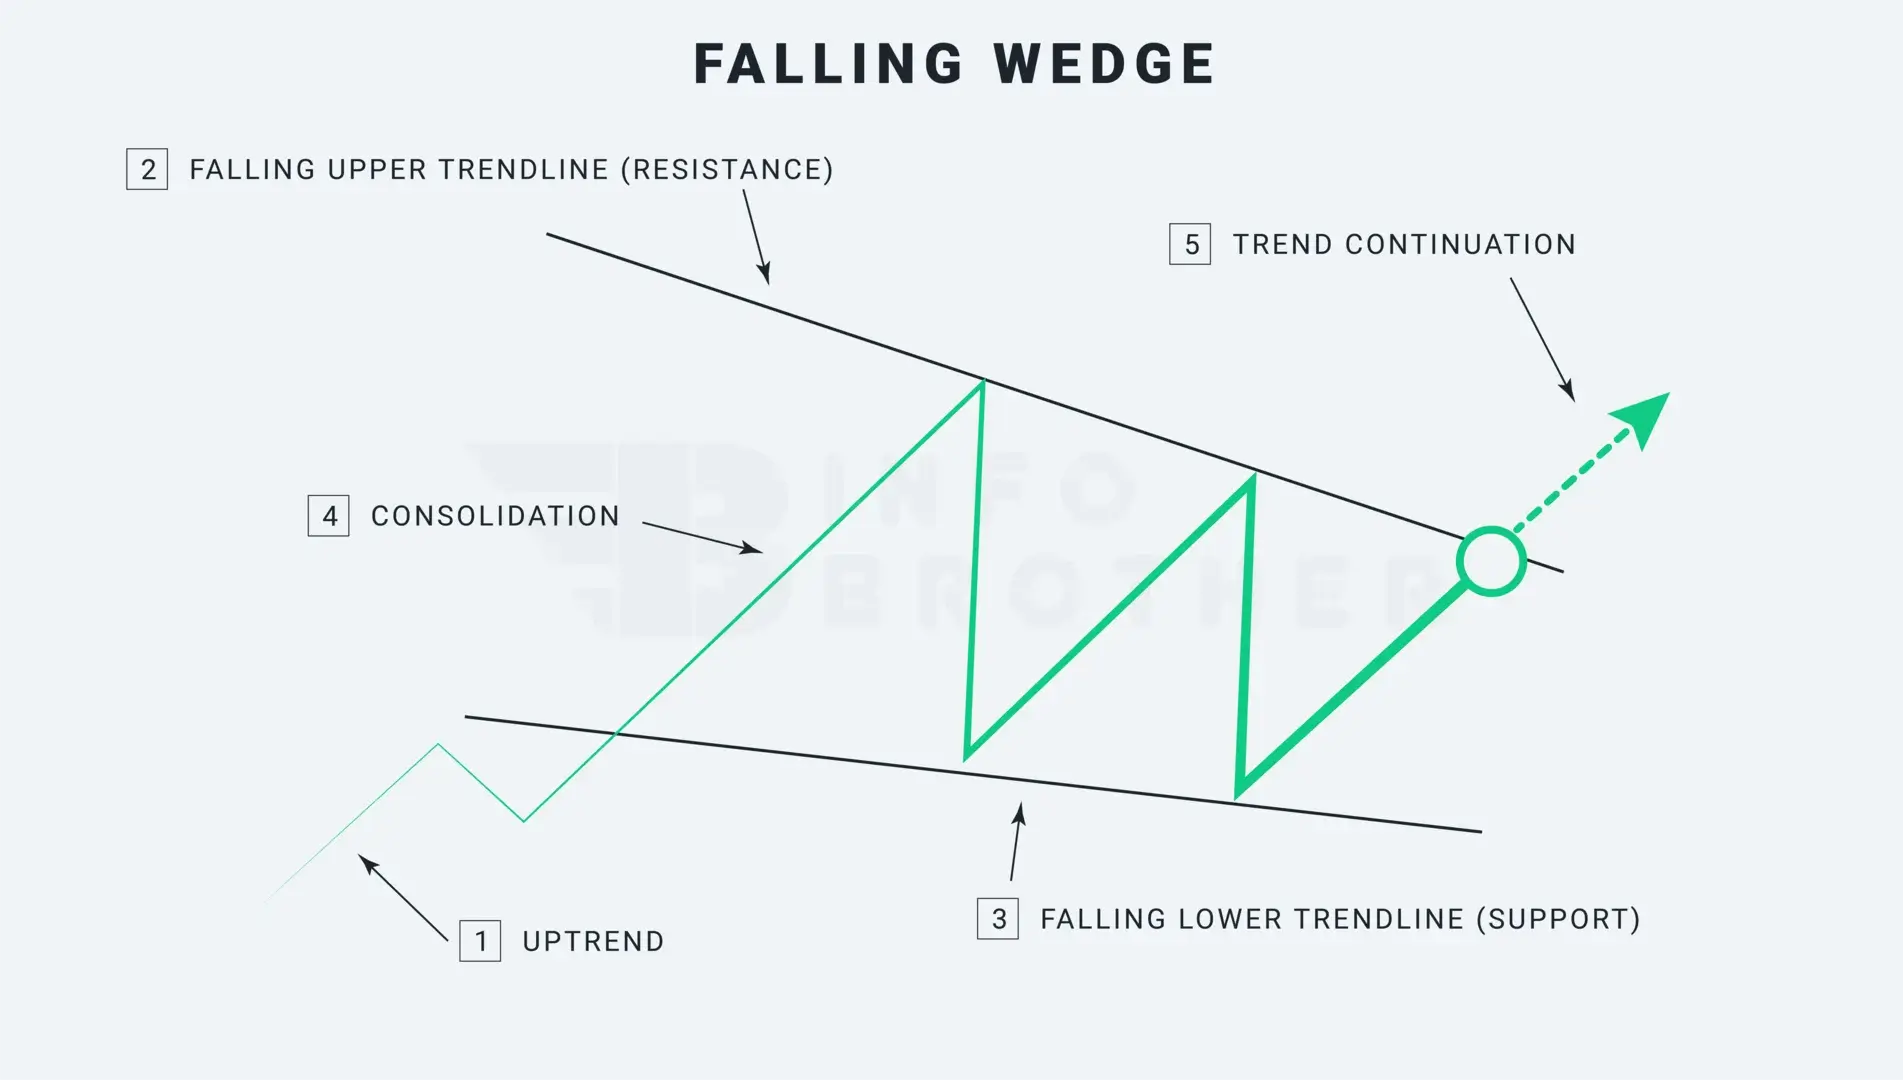
The falling wedge pattern can be confusing to recognise since it is seen as both a bullish continuation and bullish reversal pattern. Both situations include various market conditions that must be taken into account.
The market's direction is what distinguishes the continuation pattern from the reversal pattern. The falling wedge pattern will be regarded as a continuation pattern if the market is moving upward. The falling wedge pattern will be seen as a reversal pattern if the market is trending lower.
There are five factors to think about while figuring out the pattern.
1. A upward trend:
The market must be moving upwards for a pattern to be considered a continuation. When the market is moving lower, the falling wedge is viewed as a bullish reversal signal.
2. Falling upper trendline:
During the consolidation stage, connect the higher highs to create a falling trendline or resistance level. The upper trendline can only be drawn if there are at least two swing highs. However, to qualify as a falling wedge pattern, each high must be lower than the prior highs.
3. Falling lower trendline:
Draw a lower falling trendline or support level during the consolidation period by connecting the lower lows. The lower trendline may be drawn using at least two swing lows. However, each low must be lower than the one before it in order for the pattern to qualify as a falling wedge.
4. Consolidation Phase
As the pattern develops throughout the market's consolidation phase, the top trendline and lower trendline come together to create a cone.
5. Uptrend Continuation
When a falling wedge formation breaks out and the price rises over the resistance level, the previous upward trend has been restored. The candle that breaks out of the descending wedge formation should do it quickly and with great volume.
At least two swing highs and two swing lows are required for trendlines. On the other hand, more trendline interactions lead to more reliable trading results.
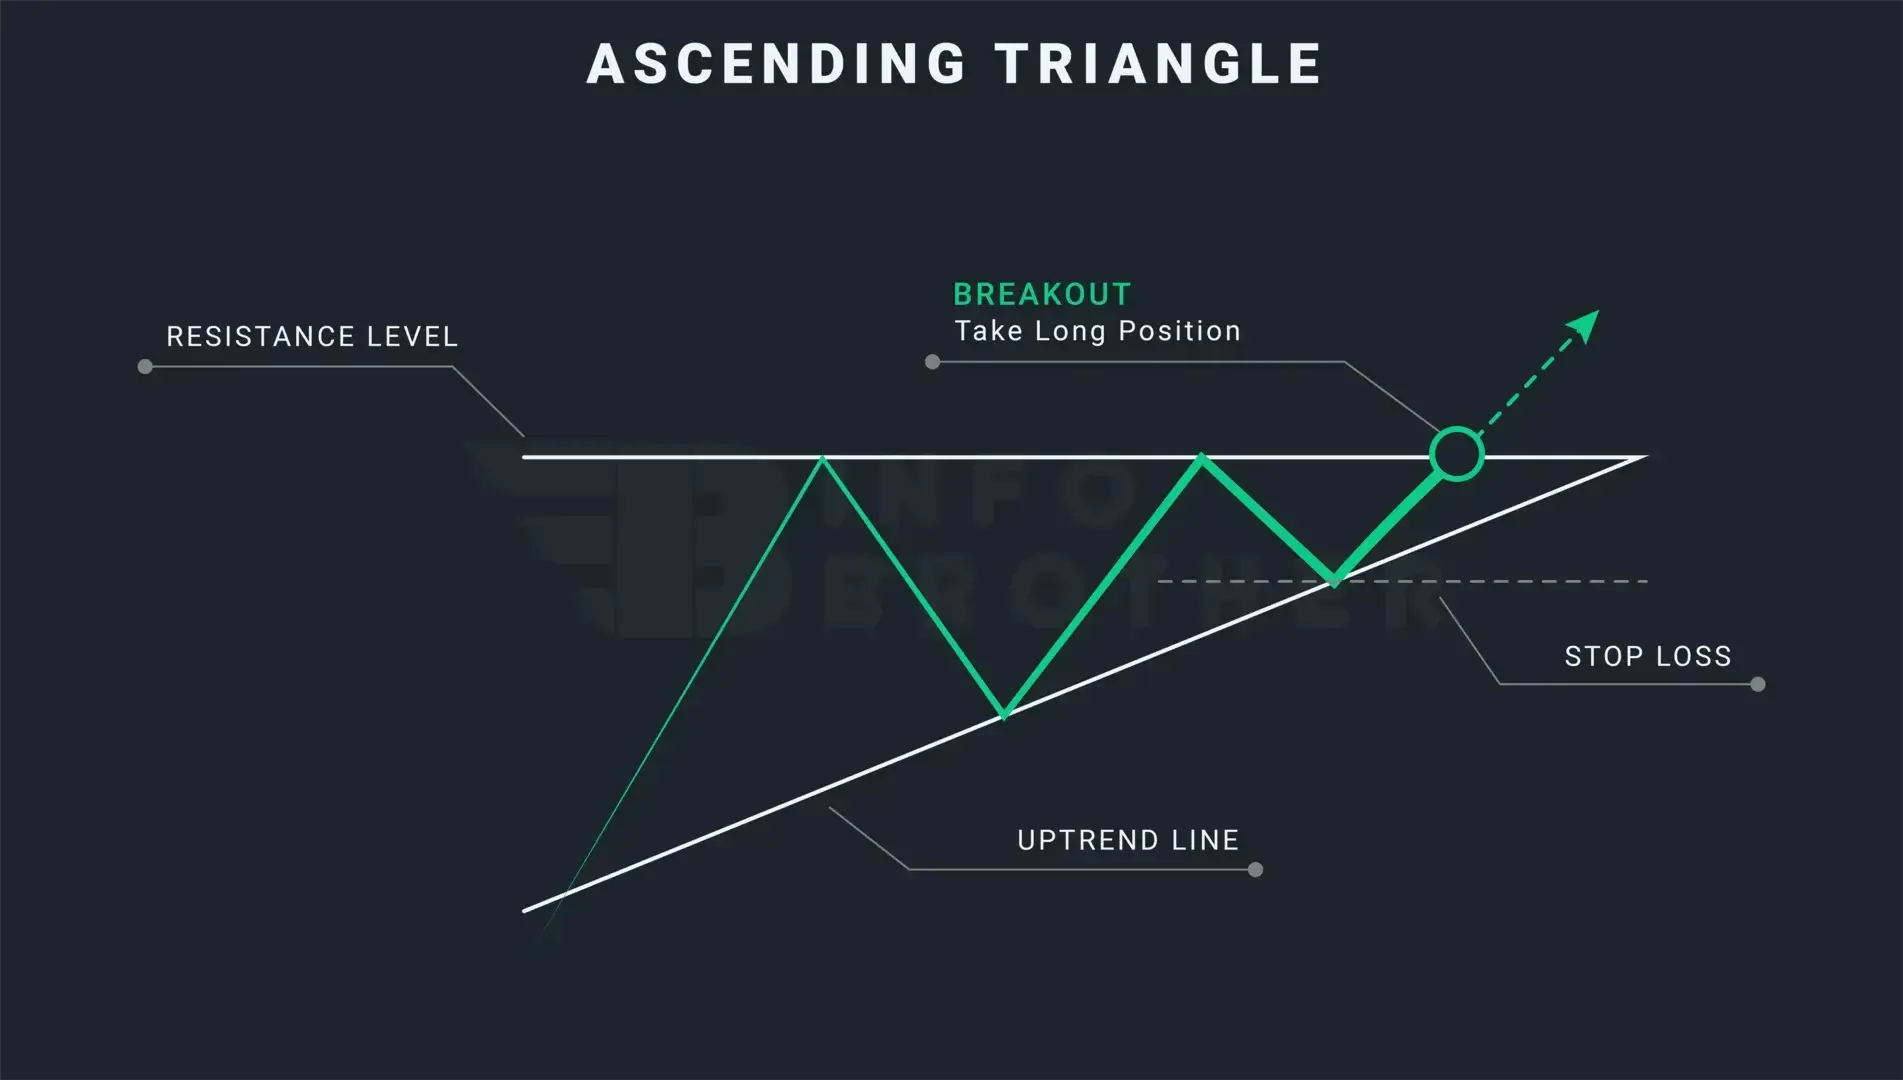
The Difference Between Falling Wedge and Ascending Triangle:
The ascending triangle pattern is a rising trend pattern that denotes the start of a bullish trend and suggests a flat top with higher lows. On the other side, the falling wedge pattern..
Read More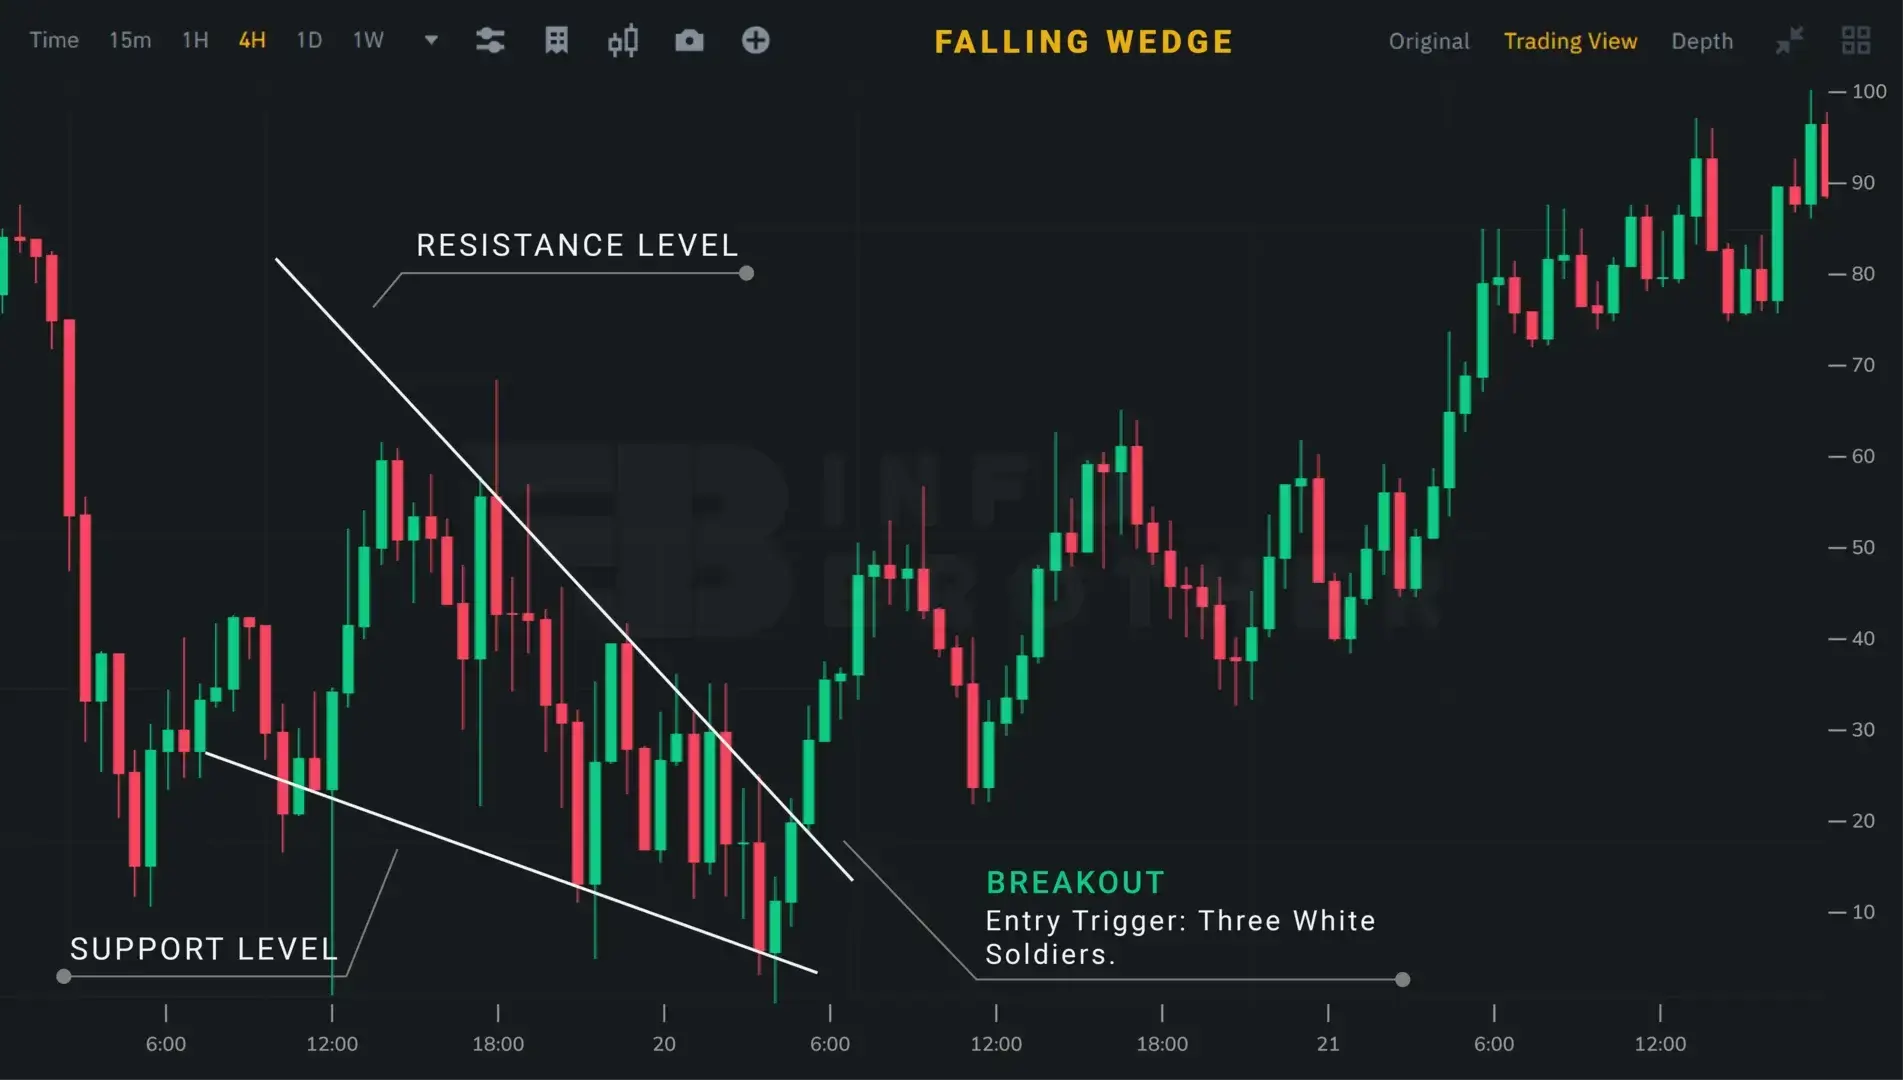
As we are aware, depending on the conditions of the market, the falling wedge pattern may be both a bullish continuation pattern and a bullish reversal pattern. The same trading tactics, though, may be used in both scenarios. Once a falling wedge meets all the requirements, we must concentrate on the key components of a trade, such as the entry position, stop loss, and take profit.
Here are some common methods to use when trading a wedge pattern.
- Recognize the chart pattern of a falling wedge. To accentuate the pattern, draw trendlines along the swing highs and swing lows.
- Keep a lookout for the breakouts. This indicates that the price is going outside the defined wedge pattern.
- When the price breaks above the resistance level and the breakout is verified, open a long position.
- We may set the stop-loss right below the lower trendline, on the opposite side of the wedge's breakout.
- The take-profit goal may be the height of the wedge at its thickest point.
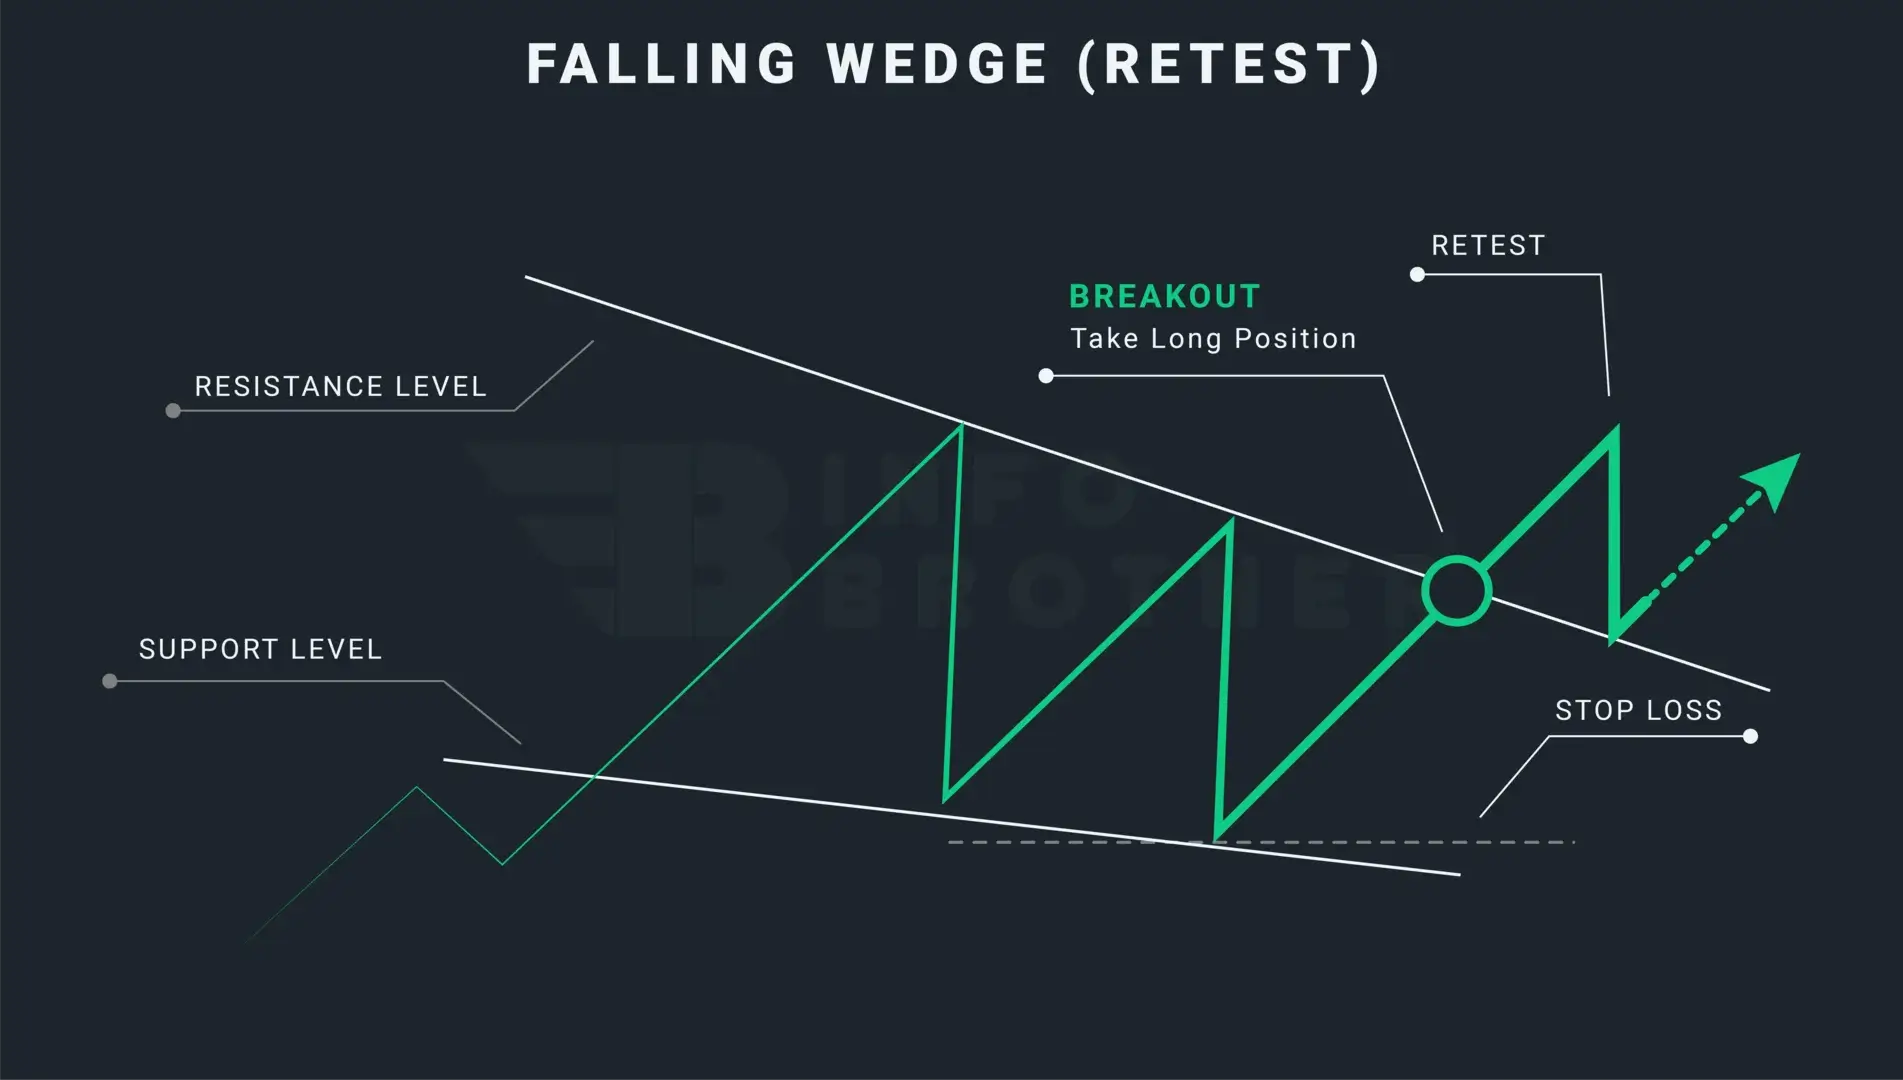
Retesting is the act of bringing a price back to a level that the market has previously breached. A retest, which happens when the price breaks through the trendline and returns to retest the resistance or support level that was just crossed, may be used by traders to prevent false breakouts.

Sardar Omar
I did my hardest to present you with all of the information you need on this subject in a simple and understandable manner. However, if you have any difficulties understanding this concept or have any questions, please do not hesitate to ask. I'll try my best to meet your requirements.
Disclaimer:This material is provided purely for educational purpose and is not intended to provide financial advice.
