eBOOK/PDF
No ads? No problem! You can download our tutorials in a printable PDF format or as an EPUB file, optimized for your tablet or eReader.
Double Bottom pattern
Double Bottom Pattern: Master Bullish Reversal Strategies in Trading.
We have a limited number of chart patterns that clearly identify a market direction shift. The double bottom pattern is one of these, and most experienced traders look for it to initiate a long position and profit handsomely.
In this chapter, we will thoroughly define the Double Bottom pattern, exploring its key characteristics and significance in the market. We'll guide you through the process of accurately identifying this powerful bullish reversal pattern on a chart, and demonstrate step-by-step how to enter a long position with confidence, maximizing your potential for profitable trades.
| Name: | Double Bottom |
|---|---|
| Forecast: | Reversal Pattern |
| Trend prior to the pattern: | Downtrend |
| Opposite pattern: | Double Top |
| Accuracy rate: | 96% |
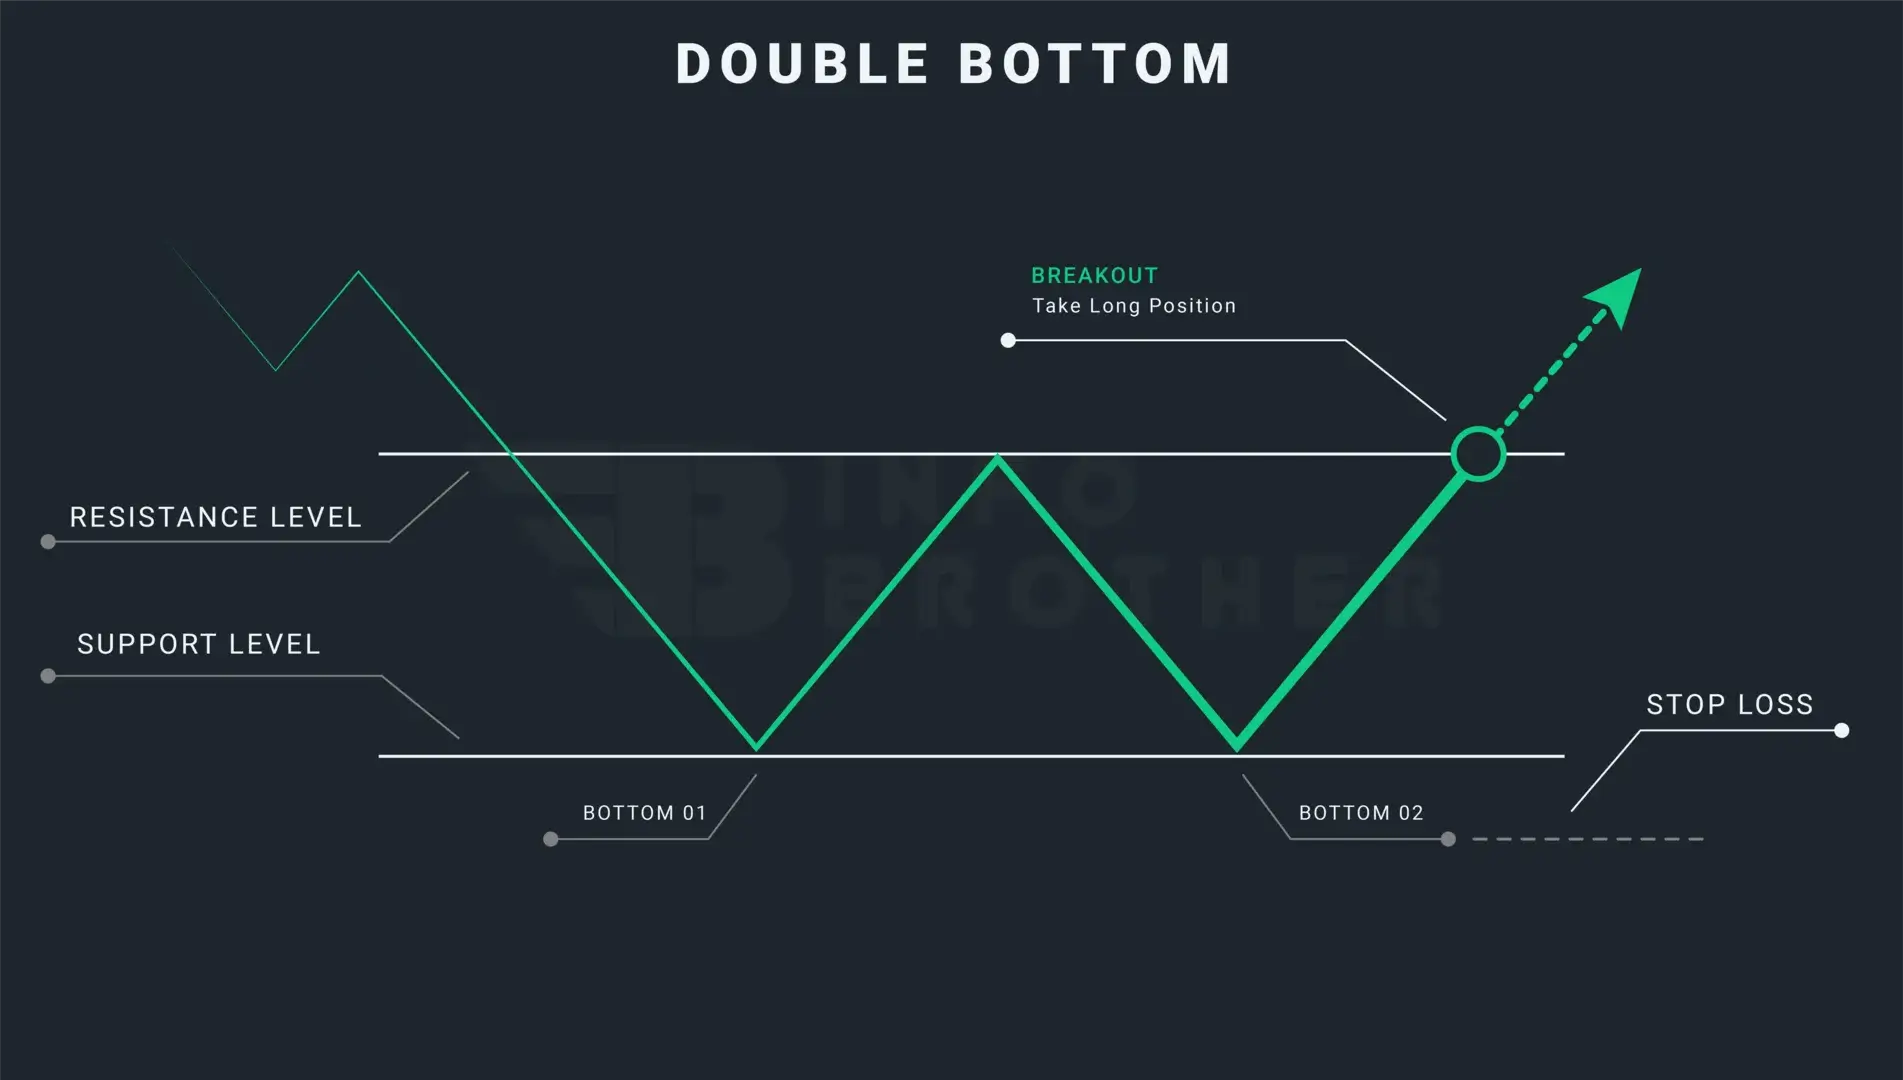
The double bottom pattern is a bullish reversal pattern that appears at the bottom of a downtrend and indicates that buyers are gaining strength while sellers are losing momentum. Because of the twice touched low, which we consider to be a support level, this pattern resembles the letter 'W.'
A double bottom is a pattern that indicates a gradual shift from past leading price action. It is seen near the end of a downtrend. The price action prints lower highs and lower lows as it travels down, then rises and moves back down to retest the prior low.
According to the technical expert, the twice-touched lows act as a support level and prevent sellers from printing a new low below the old bottom, giving buyers the chance to drive prices upward. As a result, we have two lows that resemble the letter 'W,' which we refer to as the 'double bottom.'
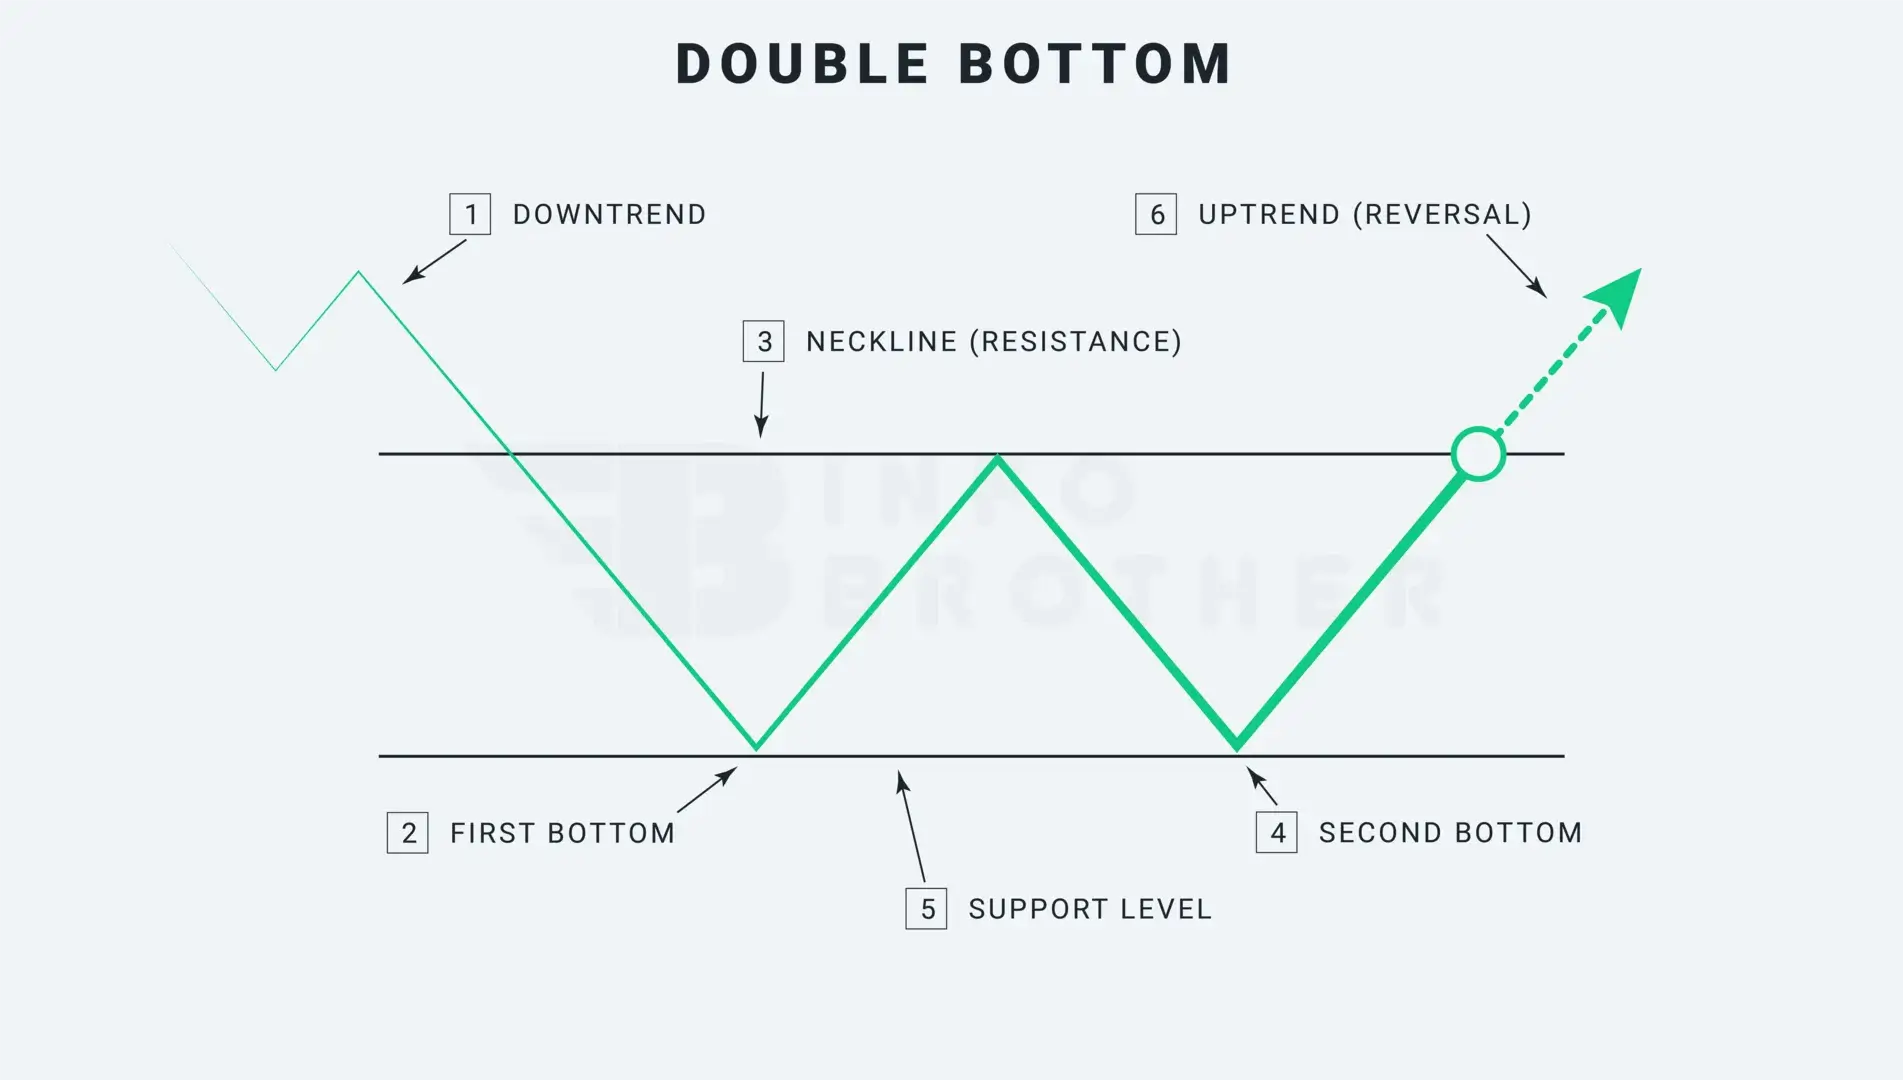
In a downtrend, a double bottom chart pattern is a bullish reversal pattern. Two lows below the resistance level, sometimes referred to as the 'neckline,'' create this pattern. After the first low is made following a significant downturn, prices bounce back to the neckline resistance level before dropping to the level of support and creating the second low. The construction of this pattern will be complete when the price moves back to the neckline following the creation of the second low. When the price breaks through the neckline or resistance level, traders join the market.
There are six factors to think about while figuring out the pattern.
1. A downward trend:
There must be a trend that already exists in order for a reversal pattern to occur. A considerable downturn should exist in the case of a double bottom reversal pattern. If the trend is sideways or uptrend , the trader should avoid this pattern. The downtrend preceding this pattern is significant.
2. The First Bottom:
The present trend should have reached its lowest point at the initial low. As a result, the initial low appears rather average, and the downtrend is still clearly present.
3. The Neckline
After the initial low, there usually follows an increase of between 10% and 20%. However, a rise might indicate early accumulation. The volume of the advance from the initial low is often insignificant.
4. The Second Bottom
The price continued to decrease from the neckline or level of resistance to form the second low. This drop often has little volume and encounters resistance from the preceding low.
5. Level of Support
Connecting the lows will provide the support level. These twice-touched lows show that the sellers are unable to make a new bottom and that the buyers have a chance to drive up the price.
6. Upward trend
The price breaking through the neckline or resistance level indicates that the sellers are losing the upper hand and the purchasers are driving the price upward.
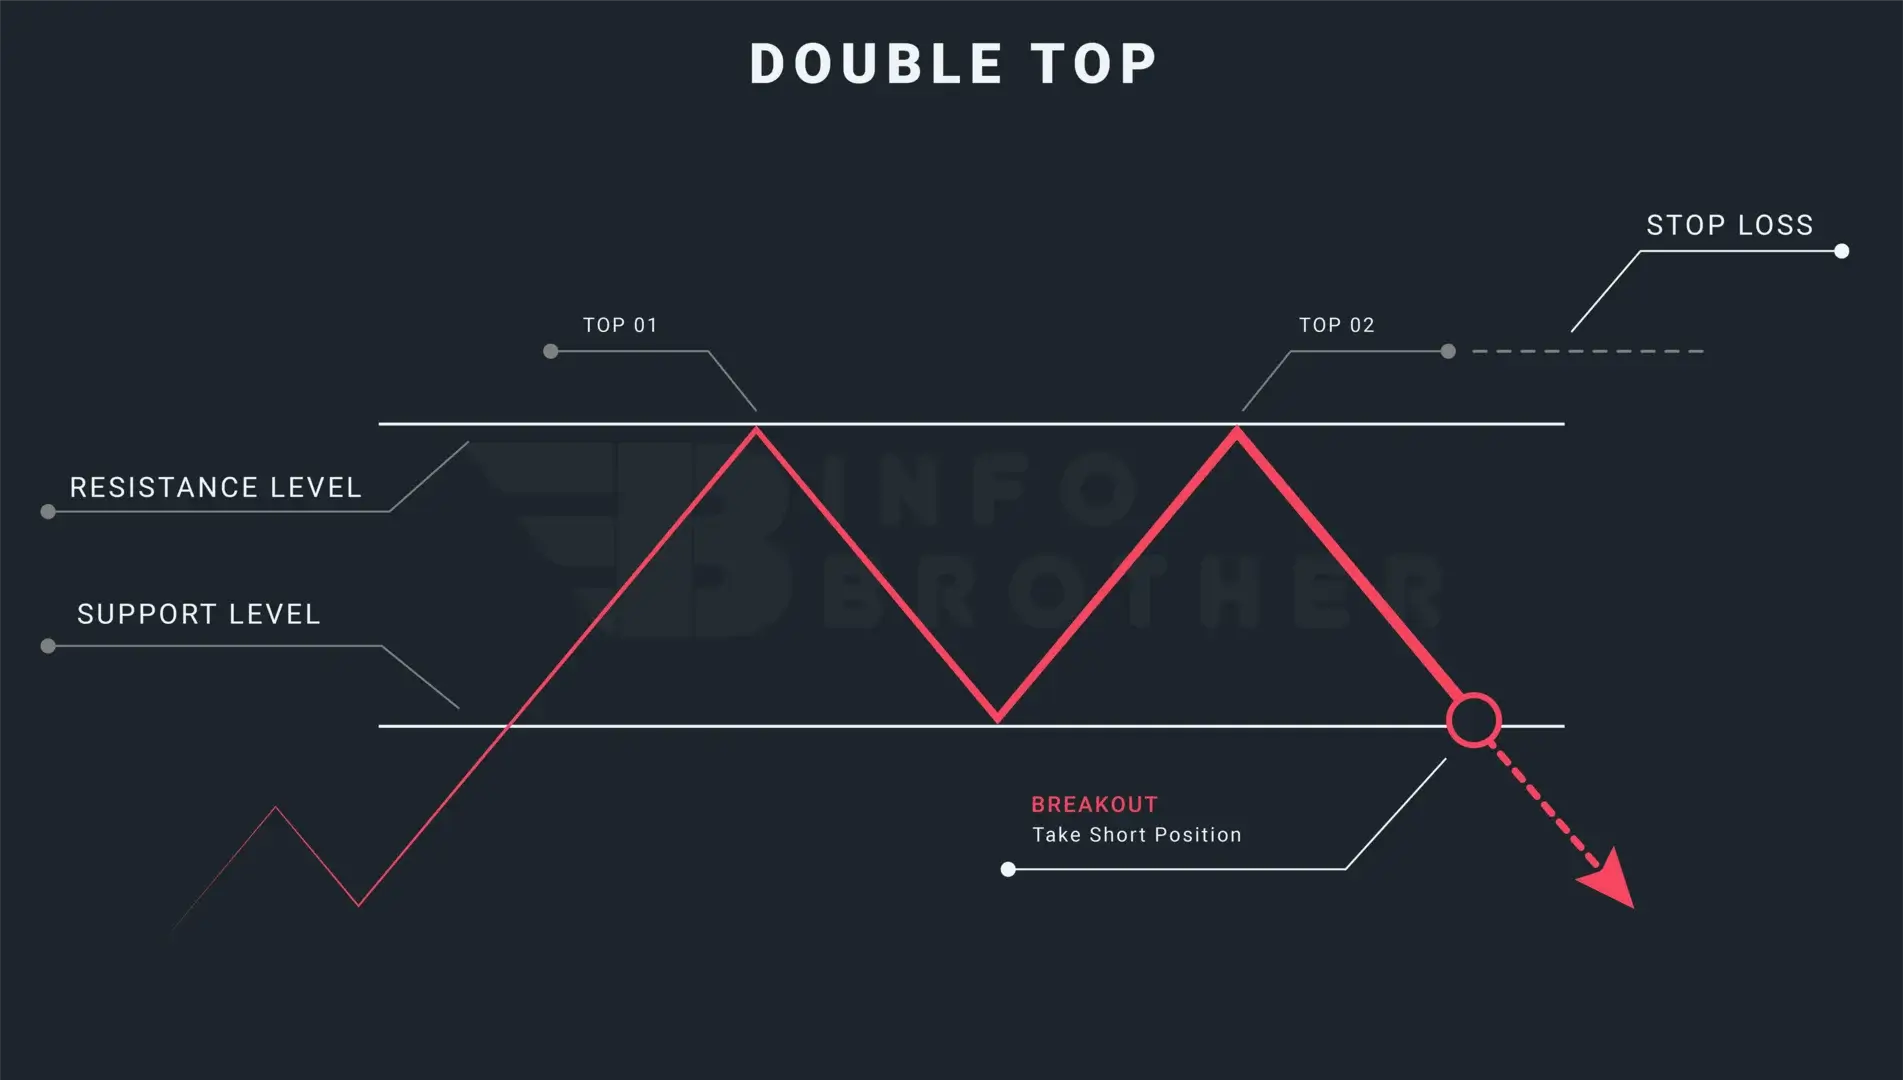
The Difference Between Double Bottom and a Double Top:
Although they each seem distinct, these patterns are both reversal patterns. A double bottom that resembles the letter "W" signals a bullish turn. while, the letter 'M' indicates for a double top pattern
Read More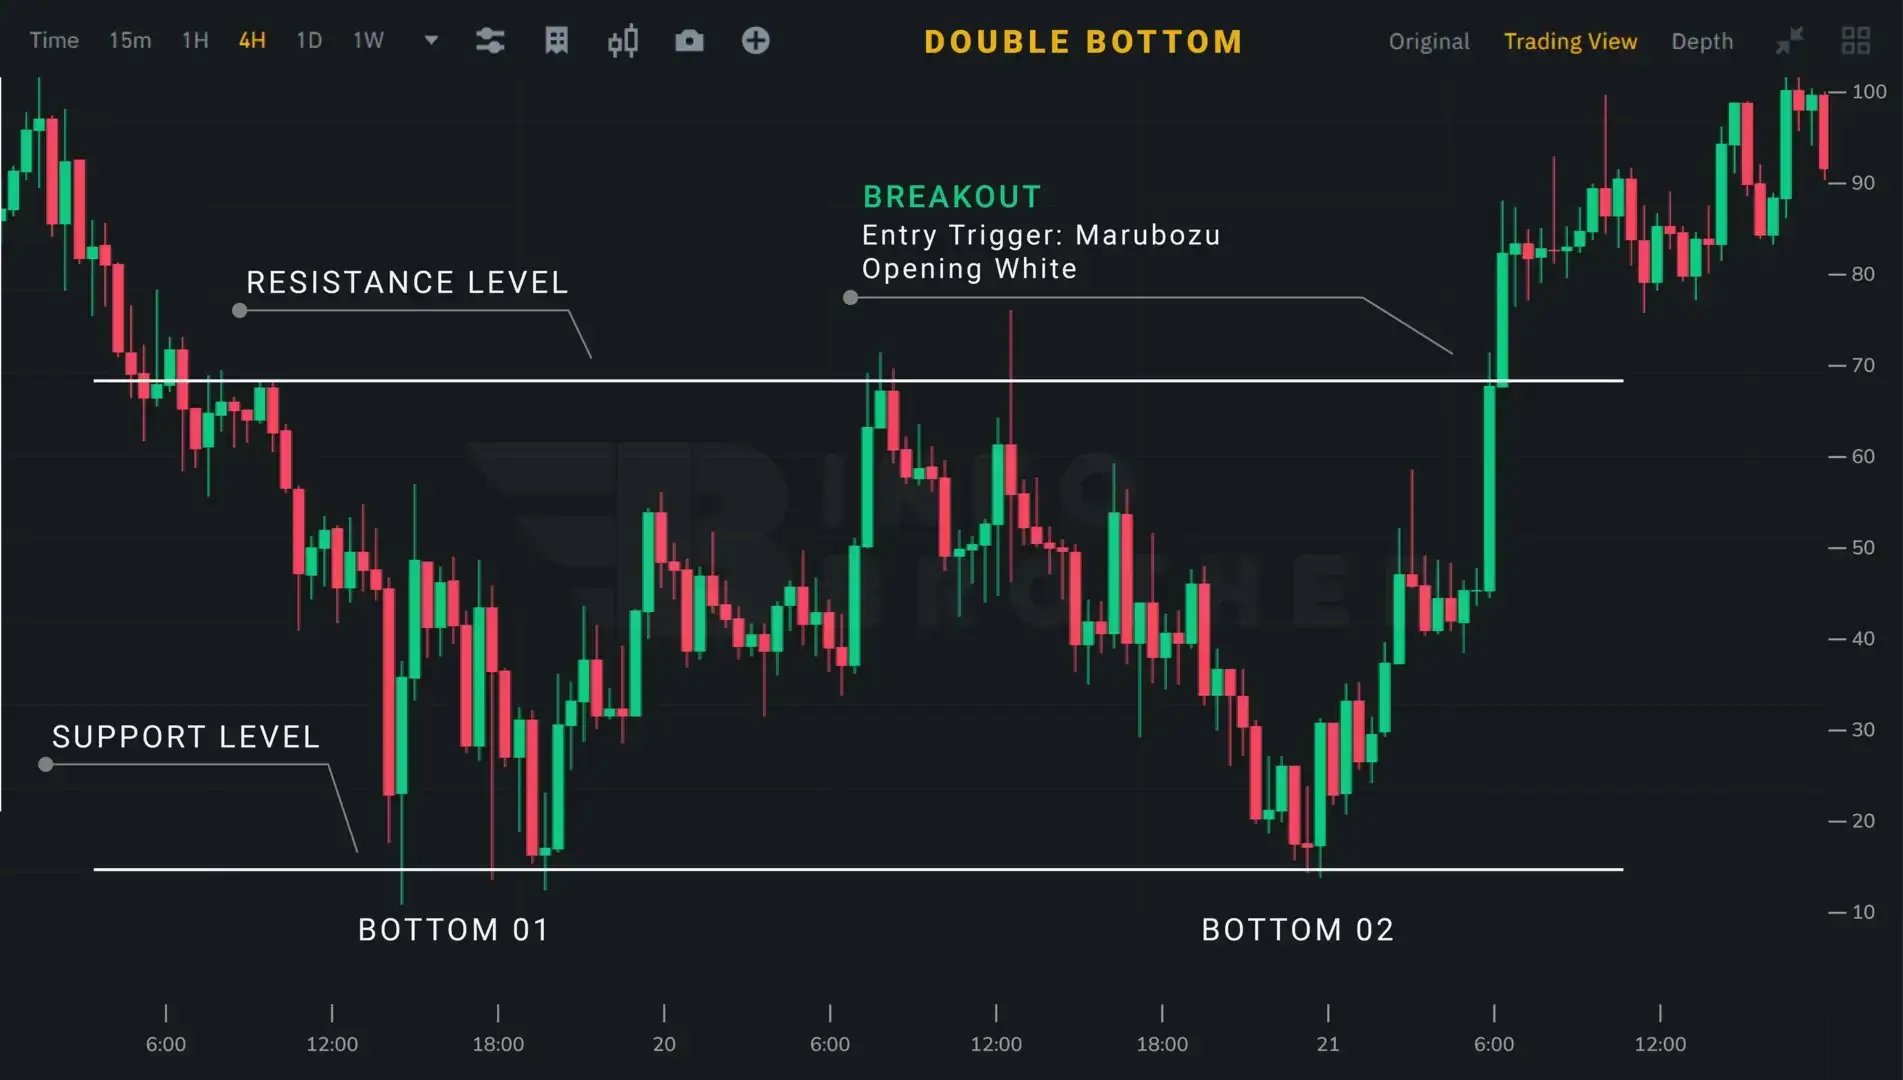
Double bottoms are reversal patterns, so traders should make sure the market is downtrending before trading. A trader should stay away from this pattern if the market is moving sideways or upward.
- Only take a long position when the price breaches the neckline or the resistance level.
- The second bottom of the pattern is where the stop-loss should be put.
- The neckline to bottom measurement should be the same as the price goal.
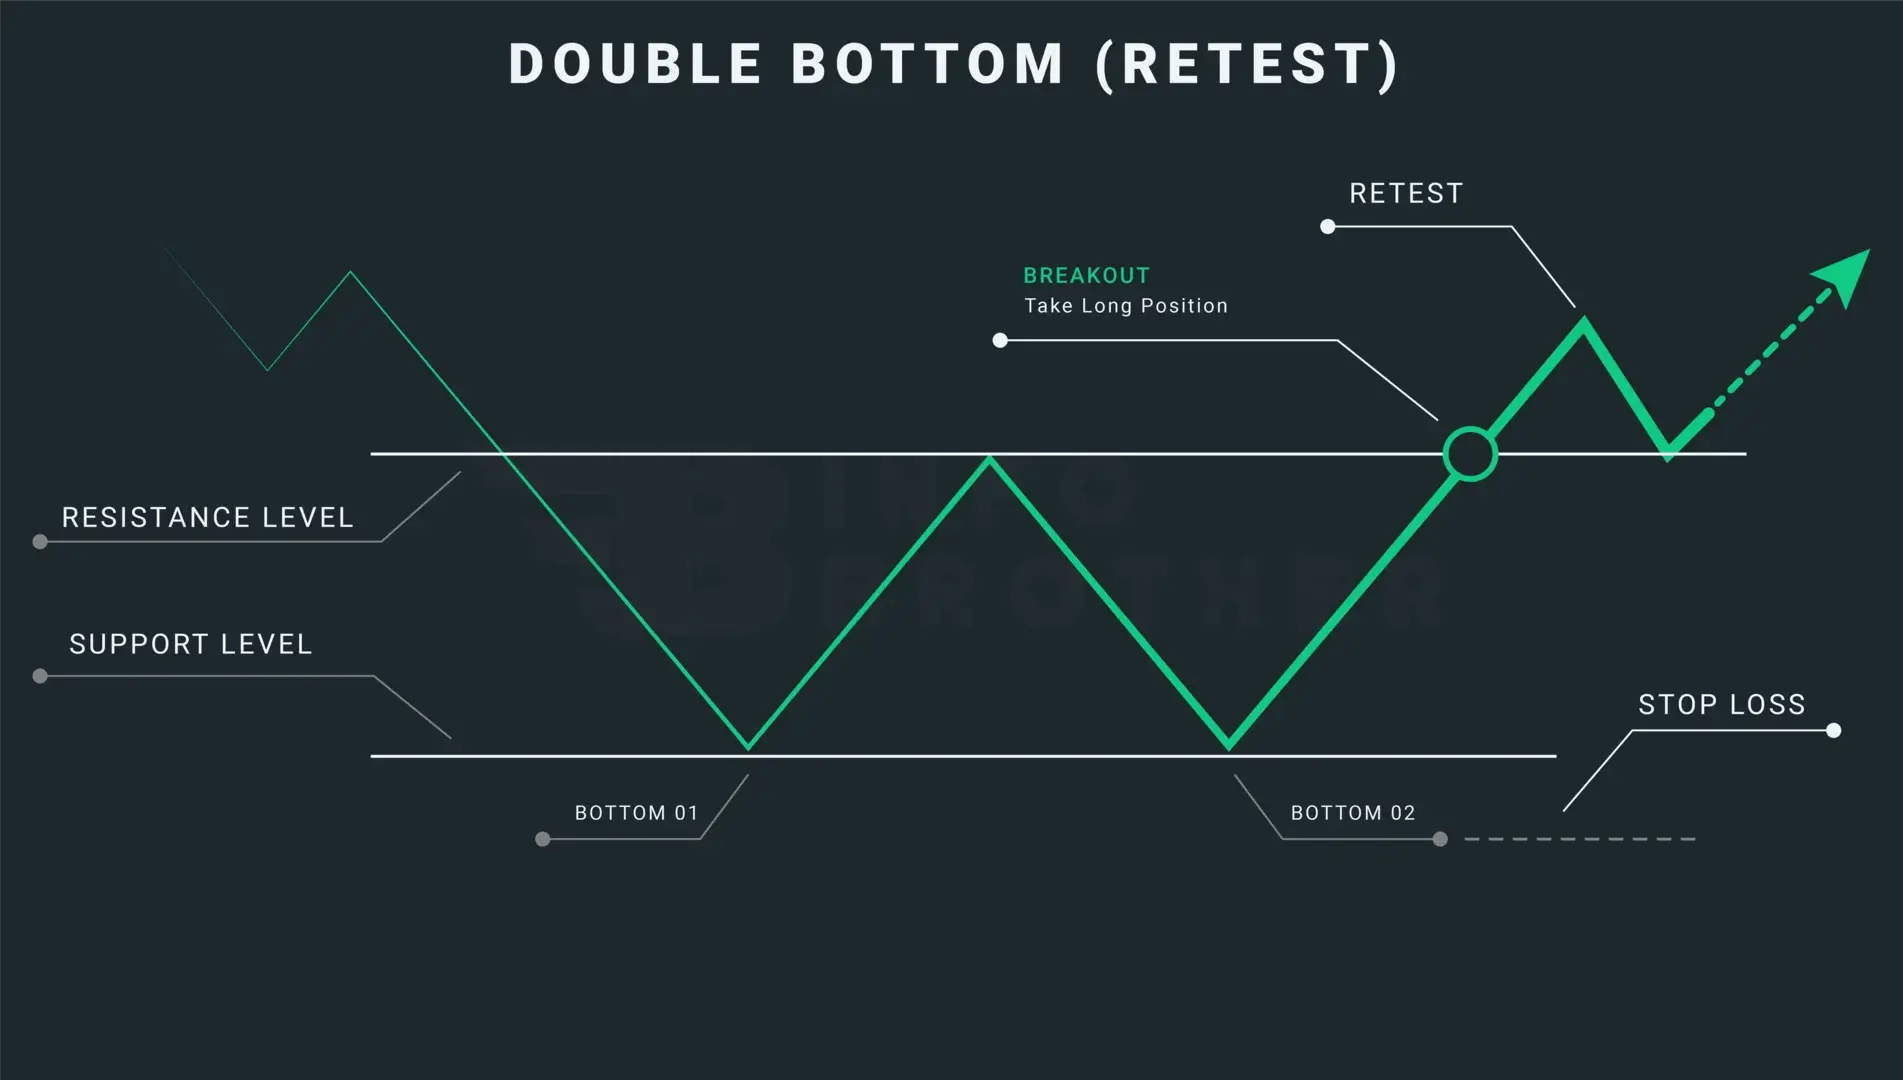
The process of the price returning to the level that the market previously broke is known as retesting. To avoid false breakouts, traders might wait for a retest, which occurs when the price breaks through the trendline and returns to retest the just passed resistance.

Sardar Omar
I did my hardest to present you with all of the information you need on this subject in a simple and understandable manner. However, if you have any difficulties understanding this concept or have any questions, please do not hesitate to ask. I'll try my best to meet your requirements.
Disclaimer:This material is provided purely for educational purpose and is not intended to provide financial advice.
